AFL Prediction & Analysis

Models Leaderboard: Winners 2018

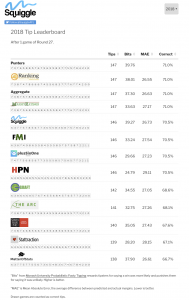
Congratulations to Darren O’Shaughnessy at AFL Live Ladders for topping the 2018 Squiggle computer models leaderboard with 147 tips!

147 was a popular number: That’s also the number of correct tips recorded by Punters (an average of many bookies’ closing lines) and Aggregate (an average of models in the competition). I noticed The Roar’s “The Crowd” scored 147, too.

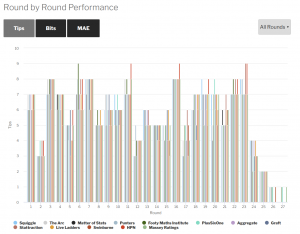
That’s a good showing, and one that demonstrates, I think, a real “wisdom of crowds” effect, where the average tip is smarter than most of the individual tipsters it’s averaging. There was a lot of variation between models across the three tracked metrics (correct tips, Bits, and Mean Average Error), but Aggregate finished near the top on all of them. In fact, had it not been for one wild model tip in the West Coast v Melbourne prelim, Aggregrate would have finished clear on top with 148.

Models leaderboard: Click for interactive table

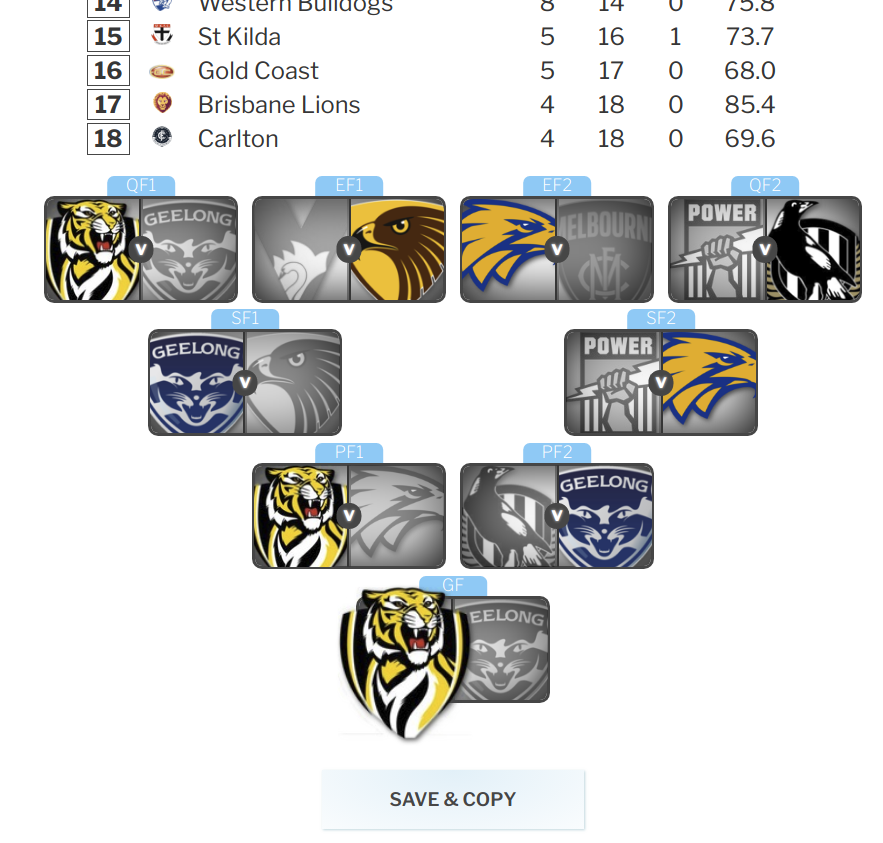
Massey Rankings, new to the Squiggle leaderboard in 2018, had a great year, correctly tipping the Grand Final to equal AFL Live Ladders on 147 tips. (We tie-break on Bits.)

In terms of MAE, AFL Live Ladders was #1 here, too, with a delightful 26.55 for the season, narrowly beating out Matter of Stats (26.61) and Aggregate (26.63).

On Bits, Squiggle was the best computer model with 39.27, although was narrowly pipped by Punters (39.76) overall.

Tony Corke at Matter of Stats had a year that demonstrates why the number of correct tips is a noisy metric, jostling for top spot on MAE and Bits but coming dead last in tips. This was never more evident than in Round 20, where Matter of Stats got the wrong end of all four of Super Saturday’s 50/50 games. Sometimes football is a harsh mistress.

HPN’s new model PERT provided tons of contrarian excitement, being the only one to tip 9/9 more than once — it did it three times — and finishing a solitary tip behind the leaders. This came about despite blowouts in MAE and Bits, so it will be interesting to see how it backs up in 2019.

Stattraction, also new this year, stumbled early, then made an extraordinary 24/27 run to close out the home & away season.

plusSixOne recorded the most correct finals tips with 7, including the Grand Final. It also finished only 1 behind the leaders for the year, along with Footy Maths Institute, who fought a highly entertaining running battle for outright leadership that came unstuck only in the finals.

Click for interactive chart

Heartfelt thanks to all the model authors — as well as those I’ve named, there’s also The Arc, Graft, and Swinburne University — who allow me to aggregate their tips! They do fantastic work and I hope that a comp like this means more people get to see it.

I also hope this site is useful to model builders out there who just enjoy playing around with footy numbers and want to know how their tips compare. (See: the Squiggle API.)

And thank you to the regular human visitors, who just like to keep an eye on what the models are saying.

The off-season is time for model tuning, so I hope our current crop will be back in 2019 with new and improved engines! I’d also love to add new competitors to keep them on their toes — if you’d like to join the fun, please check out this wishlist and contact me via Twitter.

Have a happy off-season! May your trades be fruitful, your drafts foresighted, and your spuds delisted.

Max.

What If: The Top Team Always Hosted The Grand Final (An Alternate History)

Rule: The Grand Final shall be hosted at the home ground of the participating side that finishes highest in the regular season and wins all its finals.

Result HGA* Adjusted venue Adjusted HGA Adjusted result
1991 HAW by 53 HAW +6.3 Waverley Park

Disaster in the west as the Eagles, seemingly on track to host the first ever Grand Final outside Victoria, lose their Qualifying Final at Subiaco to Hawthorn. It delivers the Hawks the right to host the Grand Final at their home ground of Waverley Park, which, in a convenient twist of fate, is where it would have been held anyway, as the M.C.G. is unavailable due to renovations.

Hawthorn duly defend Victorian pride, keeping both the premiership and the Grand Final a local affair for one more year.

Result HGA Adjusted venue Adjusted HGA Adjusted result
1992 WCE by 28 GEE +3.7 Subiaco WCE +12.1 WCE by 44

A series of unexpected results sends the Grand Final to Perth after the Eagles upset the Cats in a semi-final. A fortnight later, the Eagles repeat the performance and set Perth alight with a historic home premiership.

Continue reading “What If: The Top Team Always Hosted The Grand Final (An Alternate History)”

Squiggle: Now with Team Ins/Outs Awareness!

Earlier this year, HPN unveiled a new model named PERT based on player ratings, instead of team ratings like most other models. And it’s landed with a splash, currently sitting atop the models leaderboard on 74 correct tips.

It’s doing less well on Bits* and MAE*, which is a little suspicious, since those metrics tend to be better indicators of underlying model accuracy. But still! It’s enough to suggest there might be something in this crazy idea of considering who’s actually taking to the field.

So I’m hopping aboard. Starting this week, Squiggle’s in-house model considers selected teams and adjusts tips accordingly.

The difference that team selections make to each tip can be seen in the TIPS section of Live Squiggle.

In most cases, team selections will make only a difference of a few points to the Squiggle tip, which remains focused on team-based ratings. The adjustment is derived from a simple comparison of scores from AFL Player Ratings. So it will only swing a tip when it’s already close to a 50/50 proposition.

Over the last six years, this seems to deliver about a 0.40 point improvement in MAE. Naturally, though, 2018 will be the year it all goes to hell.

*  “Bits”: Models score points based on how confidently they predicted the correct winner. Confident & correct = gain points, unsure = no points, confident & wrong = lose points.

* “MAE”: Mean absolute error, which is the average difference between predicted and actual margins, regardless of whether the correct winner was tipped.

How to Become a Squiggle-approved Model

The Squiggle stable of models has grown to ten this year, and now includes almost all of the well-known public tipping models from across the web.

This site aims to bring together and promote the best of such models, and I’m interested in adding more. In order to keep the quality of such models high, this is what I look for:

  1. An official site where tips are posted
  2. A history of doing so for at least a year
  3. Public discussion and analysis of football
  4. Some transparency about the model

These aren’t all mandatory. There are currently some very mysterious models included in the stable because they are widely known and respected. But this is the ideal.

I know there are many solid tipsters with an Excel spreadsheet and a Twitter handle, which I don’t plan to list since they don’t meet the above criteria.

Ultimately my goal is to expose more insight into the how and why of football analysis, looking not only at who is tipping best, but why. What is the best way to treat Home Ground Advantage? How much difference does the weather make? How important is it to consider player rankings, or recent form? What factors matter most in determining which side wins a game of football?

Squiggle Ladder Predictor

The official AFL ladder predictor has a few problems:

  • Not available until late in the season
  • Requires ten thousand clicks to complete
  • Created by Telstra monkeys in 1994

So I made a new one!

Squiggle AFL Ladder Predictor

Squiggle AFL Ladder Predictor

Now you can tip as few or as many games as you like and lean on the world’s best computer models to fill in the rest.

You can even go back and change some of the computer tips if you want.

I believe the world is a better place when people can generate wildly optimistic ladder projections with ease.  At the moment it’s only for the home & away season, but I’ll probably add finals sometime later.

How AutoTip Works

The Predictor fetches data from the Squiggle API, including Aggregate tips from computer models such as The Arc, Matter of Stats, FMI, HPN and many more. This provides a tip for each match as well as a confidence rating about how likely the team is to win.

It’s no good to simply tip the favourite in each game, though, because in real life, favourites don’t always win. For example, if two people play 10 games of chess, and one player is 60% likely to win each match, we want to be able to predict that the final tally will be about 6-4, and not 10-0, like we’d get if we tipped the favourite to win each time.

So AutoTip runs several thousand simulations, each time applying an amount of randomness to the predicted result, so that a team that is 70% likely to win a match will only win it in about 70% of simulations.

The simulations are then analyzed to determine the average finishing rank, number of premiership points, and percentage of each team.

This provides a pretty reliable estimation of where each team is likely to wind up on the ladder. However, we don’t merely want average numbers: We want to see specific tips for each game. So next AutoTip scores each simulation based on how closely its ladder resembles the average. Then it selects the “most normal” one.

This means AutoTip will contain many upsets, and which upsets they are will change each time. But the upsets will be spread around evenly, so that each team finishes the season about where they’re expected.

Richmond v Daylight

Richmond have been doing two things Squiggle particularly likes: Holding oppositions to low scores, and generating plenty of scoring shots.

The Tigers have been kicking plenty of behinds this season right from the start: In Round 1, they defeated Carlton by 4 goals and 14 behinds, while in losing to Adelaide the following round, they lost by 6 goals and 0 behinds.

On the surface, that’s a close-ish 26 point win followed by a heavier 36-point defeat; in terms of scoring shots, it’s a +16 smashing followed by a much closer -6.

Squiggle’s model considers the reality to be somewhere in between. As a result, it considers the Tigers’ only loss of the season so far to be a relatively close one, away interstate to a very good team – the kind of game that even a top team will often drop. The Tigers’ wins, on the other hand, have included some extraordinary smashings when viewed in terms of scoring shots.

Richmond’s opposition to date has mostly included mid- to upper-tier rated teams in Adelaide, Collingwood, Hawthorn, and Melbourne, yet across the season’s 6 rounds, the Tigers have averaged 50% more scoring shots. The result is a lot of Squiggle love for the yellow and black.