It’s hard to prove the fixture affects any team’s finishing position. To say that, you need to find games that were so close that the result could easily have been different, and establish that they were scheduled in a lopsided way.
The only really clear examples of this tend to be self-inflicted wounds, where a club sells a home game and loses it narrowly — such as Richmond’s famous after-the-siren loss in Cairns to the Gold Coast in 2012, or St Kilda’s 3-point defeat by Brisbane in New Zealand in 2014.
These cases are nice and clear: Computer modeling can tell us with a high degree of certainty that Richmond’s home ground advantage at the M.C.G. is worth more than 2 points, and therefore they should have won the game if it had been played there. Likewise, St Kilda should have defeated Brisbane if they’d stuck to their regular home ground in the Docklands. Of course, you can point to many things that could have changed a close result, but one of them is the venue.
Otherwise, though, the picture is muddier. You can establish that a team had a favourable fixture — weaker opponents than average, or games at friendlier venues — but you can’t really say it was worth a certain number of wins. When Fremantle played Gold Coast “away” in Perth this year, due to the unavailability of Carrara, that was certainly unbalanced fixturing… but the Dockers won the game by 28 points, so would the result have been different in Queensland? Modeling suggests probably not.
However, you can say one thing for sure: St Kilda got screwed.
| St Kilda (2018) |
| Net Benefit from Fixture: -123 points (ranked 18th) |
| Opposition: 18th |
Timing: 12th |
Home Ground Advantage: 18th |
St Kilda is no stranger to scheduling screwings. It had the AFL’s worst fixture in 2014, the worst in 2015, the 9th best in 2016, and the worst in 2017. This year, it was the worst again, and that was also the worst fixture of any team in five years.
This analysis rests on three key factors: who you play (Opposition), when you play them (Timing), and where you play (HGA).
(Two factors that come up sometimes in these kinds of discussions, and which aren’t included because they don’t matter, are Six-Day Breaks and The Cumulative Effect of Travel. There is more on these at the end of the article.)
Opposition
The simplest factor is the strength of opposition. All clubs face each other at least once, of course, and the AFL attempts to equalize the competition by ensuring that Bottom 6 teams have no more than one double-up game against a Top 6 opponent.
This is fine in theory, but since this year’s performance isn’t a reliable guide to next year, it often works out less well in practice.
St Kilda was a Middle 6 team in 2017, finishing 11th. They were duly given a 2/2/1 split of double-up games: That’s two matches against Top 6 opponents, two against Middle 6 opponents, and one against a Bottom 6 opponent.
This was already a touch on the mean side, since two other Middle 6 teams were assigned the more favourable 1/2/2 split.
But the Saints’ real misfortune came from how its double-up opponents — Richmond, GWS, Melbourne, Hawthorn, and North Melbourne — performed unexpectedly well. This turned their 2/2/1 split into 4/1/0: four double-up games against this year’s Top 6, one against the Middle 6, and none against the Bottom 6.
And that put the Saints into a whopping 95-point hole for the season.
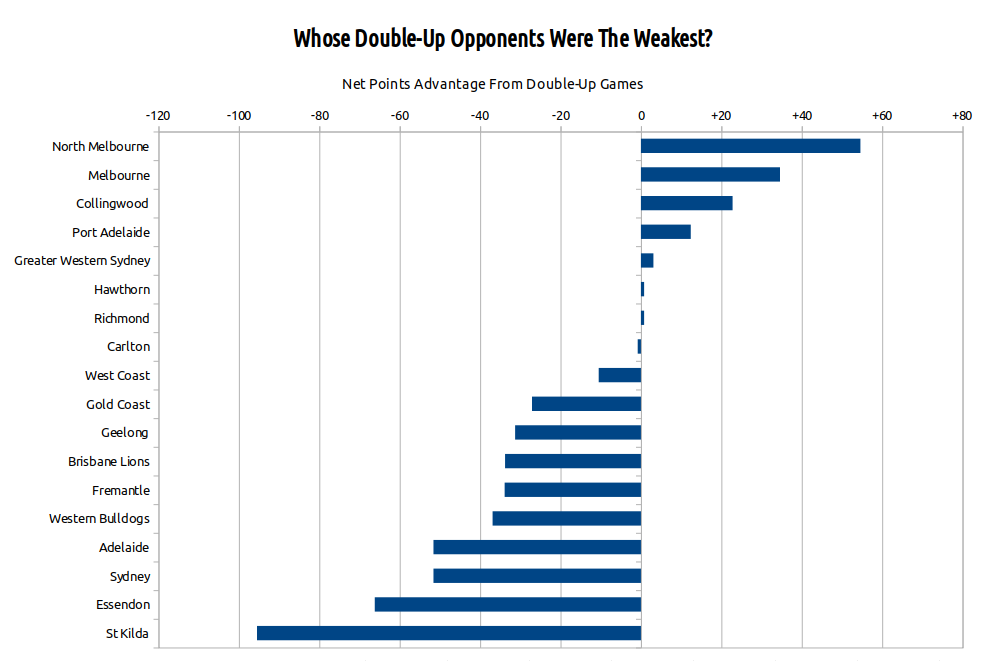
You can also see that in practice there isn’t a whole lot of equalization going on here. Many of 2017’s stronger teams had weaker than average double-up opponents (Melbourne, Port Adelaide, GWS, Hawthorn, Richmond), while many of last year’s lower teams faced harder than average opposition (Gold Coast, Brisbane, Fremantle, Western Bulldogs, St Kilda).
At least North Melbourne, the recipient of this year’s most beatable opponents, had a generous fixture by design. After finishing 15th in 2017, the Kangaroos were given a 1/2/2 split, which turned out to be 0/1/4, with repeat games against Brisbane, Gold Coast, Western Bulldogs, St Kilda, and Sydney.
Timing
There’s a problem with considering strength of opposition like this: It assumes that teams are equally strong all season long. That’s clearly not the case. Team strength fluctuates both on a weekly basis, as star players get injured and miss games, and over the medium- and long-term, as a club gets stronger or weaker for any number of reasons: fundamental gameplan changes (Essendon), or deciding the season is lost and looking to the future (Carlton), ramping up toward finals (West Coast, Melbourne), or simply having the wheels fall off from no discernible cause (Port Adelaide).
Each club will happen to play some opponents around their weakest point and meet others near their peak. Lucky clubs will meet more opponents at times of relative weakness; unlucky clubs will run into more at times of relative strength. It should average out, but doesn’t always. And since team form can rise and fall quite a lot, it can make a real difference.
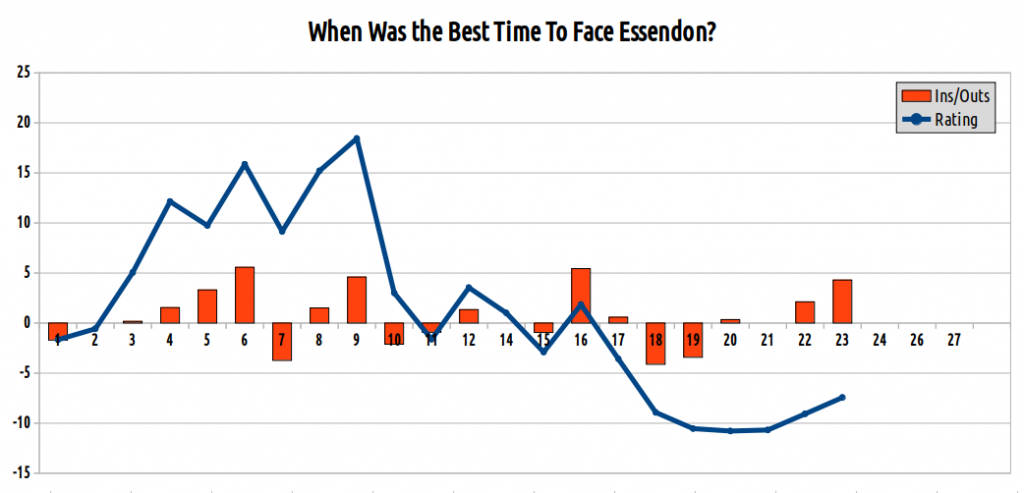
After a stirring Round 1 victory over Adelaide, the Bombers lurched from one unconvincing performance to another, culminating in their Round 8 defeat at the hands of Carlton. This led to a very public dissection, staff changes, and a very different looking team for the remainder of the season.
As such, it was quite a lot better to face Essendon early in the year. In fact, it’s possible to identify the worst possible time to play Essendon: Round 21. This is when the Bombers were performing well as a team, but just before they lost Orazio Fantasia (Round 22) and Tom Bellchambers (Round 23). As it happened, the team they played in Round 21 was St Kilda.
(Note: This is a naive rating, which means it rates the apparent strength of a team each round before they played, in order that it remain uncontaminated by the performance of the team they played against. It means there’s often a real difference between how beatable a team appeared to be and how they performed on the day. Essendon provide a fine example of this, too, in Round 9, when, after looking abysmal against the Blues and then losing Hurley and Parish, they upset Geelong.)
In truth, though, St Kilda weren’t particularly screwed by timing; not this year. They rank around the middle of the league on that metric, receiving a mix of good luck (Geelong and North Melbourne early in the season) and bad (Adelaide early, Essendon and Hawthorn late).
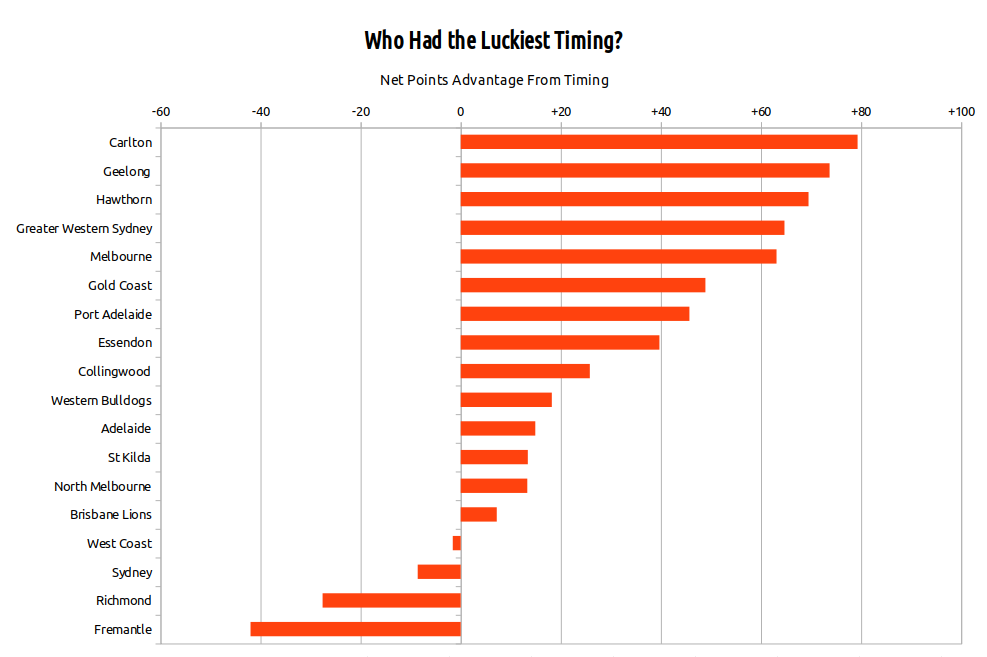
The worst timing belongs to Fremantle, who managed to encounter a string of opponents near their peak: Collingwood (round 23), Hawthorn (round 19), Essendon (round 18), Port Adelaide (round 17), Sydney (round 9), Carlton (round 13), and Gold Coast (round 3).
The Blues had the most fortunate timing, thanks to repeatedly running into teams who were losing key players to injury — although perhaps this is less to do with good fortune than their opponents seizing the opportunity to rest players. The Blues also had early-season games against teams who would dominate the season later: West Coast, Collingwood, Richmond, and Melbourne.
Home Ground Advantage
But back to the screwing. In theory, home ground avantage (HGA) is balanced: every team receives roughly the same advantage from its home games that it must face in its away games.
West Coast, for example, play ten home games against opponents traveling from interstate, and ten games to which they must travel, plus two local derbies. There’s no real HGA in a derby, and the benefit the Eagles receive from playing interstate sides at home is neatly counter-balanced by the penalty of traveling interstate to play away.
A Melbourne-based team such as Collingwood, by contrast, plays many games against other local opponents at relatively neutral venues in the M.C.G. and Docklands while hosting interstate sides about five times and traveling away about the same number.
Either way, the net benefit is roughly zero.
But there are exceptions. Sometimes teams give up a home venue they’re entitled to, such as Melbourne playing in the Northern Territory. Hawthorn and North Melbourne occasionally drag a Melbourne-based team to Tasmania, creating more venue-based advantage than there would otherwise be. And occasionally there are weird situations like the Commonwealth Games depriving Gold Coast of a home ground, sending the Suns to play a home game against Fremantle in Perth.
Also, sometimes a team is given unbalanced travel.
Now, HGA is hard to define, and various models use different methods. You can get a reasonable approximation simply by assigning 10 or 12 points of HGA whenever a team hosts an opponent visiting from out of state. A more sophisticated, but also more fragile, strategy is to attempt to divine particular teams’ affinity for particular venues from the historical record of how they under- or over-perform there.
I employ something in between, which is essentially a Ground Familiarity model. This awards HGA based on how familiar a team is with the venue and location; in practice, it serves as a proxy for an array of factors that probably comprise HGA in the real world, including crowd noise, travel time, and psychological disruption.
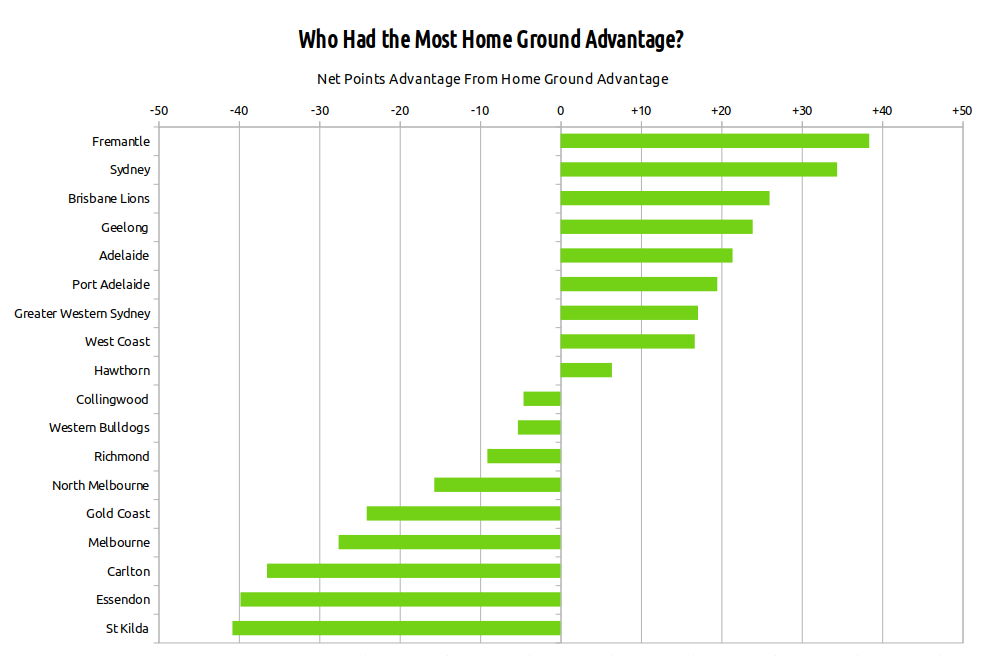
There’s a fair argument that Sydney wasn’t actually the second-most HGA advantaged team this year, because Sydney didn’t play its home ground very well. Similarly, many believe that Richmond received more advantage from M.C.G. games this year than the average M.C.G. tenant. Such ideas are popular, but tend to be transient and based on few data points. For example, for me, Richmond’s much-discussed four interstate losses are more easily explained by the fact that those were its four hardest games. So there is no attempt here to model that kind of theory.
Then again, a Ground Familiarity model has quirks of its own. Much of the reason Sydney scores well on this measure is that the Swans played 18 matches at just three grounds: the S.C.G., the M.C.G., and Docklands. They traveled to Western Australia just once and South Australia not at all. This means the Swans frequently play away at grounds they’re reasonably familiar with, while their opponents don’t have the same experience at the S.C.G.
This small but persistent imbalance affects Docklands tenants in reverse: They are almost always less familiar with their opponents’ home grounds than their opponents are with theirs. For example, the Saints are relatively familiar with Perth for a Victorian team, being dispatched there at least once a year, and four times in the last two years. But when they last met the Eagles in Melbourne, that was the Eagles’ fifth trip to Docklands that year alone. The venue still offered St Kilda an advantage (especially compared to Perth), but it was a little less than it might have been.
Therefore, under a Ground Familiarity model, being based at the Docklands is the worst option. You probably don’t even get to play home finals there.
But the real culprit behind St Kilda’s poor rating on home advantage is their persistent travel imbalance:
St Kilda’s Games vs Non-Melbourne Opponents
| Year |
Home |
Away |
Difference |
| 2014 |
5 |
7 |
-2 |
| 2015 |
5 |
7 |
-2 |
| 2016 |
5 |
6 |
-1 |
| 2017 |
6 |
6 |
0 |
| 2018 |
4 |
7 |
-3 |
| Average |
5.0 |
6.6 |
-1.6 |
Having to travel to your opponents more often than they travel to you is a clear source of home ground advantage disparity. This is rare for non-Victorian teams, who almost always have a 10/2/10 split, but common for those in Melbourne: They will often benefit a little more or a little less from travel than their opponents. For the Saints, almost every year, it’s less.
This year’s version was the most extreme yet. St Kilda enjoyed home advantage from hosting travelling teams only four times (Brisbane, Sydney, GWS, and Adelaide), while facing disadvantage from travelling interstate five times (GWS, West Coast, Port Adelaide, Fremantle, and Gold Coast), as well as having to visit Geelong at Kardinia Park (with no return home match), and Hawthorn in Tasmania.
The Saints have actually been sent to play North Melbourne or Hawthorn in Tasmania for five years in a row now, each time turning what would be a neutral game at Docklands or the M.C.G. into one where the venue favours the opposition.
Three extra games of significant disadvantage is quite a lot. The ratio is eyebrow-raising, too; the equivalent of a non-Victorian team playing 8 home games and 14 away.
Sooner or later, the law of averages will ensure that St Kilda get lucky with their double-up opponents, or else their timing. But their unbalanced travel is an enduring, deliberately fixed anchor. It ensures that whenever fortune smiles on the Saints, it’s more of a smirk.
St Kilda’s Fixture: A History
| Year |
Fixture Rank |
Oppo |
Timing |
HGA |
| 2014 |
18th |
12th |
11th |
18th |
| 2015 |
18th |
12th |
17th |
18th |
| 2016 |
9th |
2nd |
10th |
14th |
| 2017 |
18th |
13th |
16th |
14th |
| 2018 |
18th |
18th |
12th |
18th |
Continue reading “How the Fixture Screwed St Kilda”