


Three new models join the Squiggle comp:


And retiring this year is The Flag.
That makes 26 models (plus Punters). Which is, you know, quite a lot of models.
Edit (14-Mar-2024): Wait! There’s a late entry! So that makes 27.


AFL Prediction & Analysis
Three new models join the Squiggle comp:
And retiring this year is The Flag.
That makes 26 models (plus Punters). Which is, you know, quite a lot of models.
Edit (14-Mar-2024): Wait! There’s a late entry! So that makes 27.
Every year, the AFL unexpectedly releases the fixture on the first day of my holidays. Then thirty seconds later people start messaging to ask when I’m updating the site.
This year, I was in line to board my plane at Melbourne Airport. I’m about to attempt to run a half-marathon up Mt. Wellington in Hobart, by the way, so if I don’t make it back, that’s what happened.
Anyway, Squiggle is now updated for 2024, except for all the things that immediately broke because of Round 0. It will take a while until I get home and take a look at why the in-house model apparently thinks Fremantle are red-hot for next year, and whether that’s legit. I don’t think it’s super urgent because although this model has an outstanding track record, that’s based on final preseason predictions, made once we have info on off-season injuries as well as practice matches, which can change the numbers a lot.
But we have 2024 games up the top, we’re collecting 2024 tips & predictions from models, and you can use the ladder predictor, so, you know, priorities.
You can’t tell, but the first character of “0pen” above is a zero. Because the AFL realized that when everyone wants different things in the first round, it’s easier to accomodate them if you have two first rounds.
So Round 1, 2024 will be the 2nd round. And the first round, if you have to give it a number, will be 0.
That’s problematic for people like me, because I do have to give rounds numbers, and Round 0 is how I’ve always designated ratings and predictions generated prior to the start of a season. So now I have to choose:
Nevertheless, #2 is less stupid than #1. So I think that’s what I have to do.
Since Twitter has begun sliding into the sea and can’t be relied on to exist in the future.
🏆 Overall champion: @EloPredicts (156 tips)
Runner-up: @thecruncherau (154 tips)
🏆 Bits champion: @AflGlicko (35.76 bits)
Runner-up: @MatterOfStats (33.24)
🏆 MAE champion: @AflGlicko (24.91)
Runner-up: @MatterOfStats (25.09)
The s10 index for 2024, i.e. this year’s top 10 performing models by MAE:
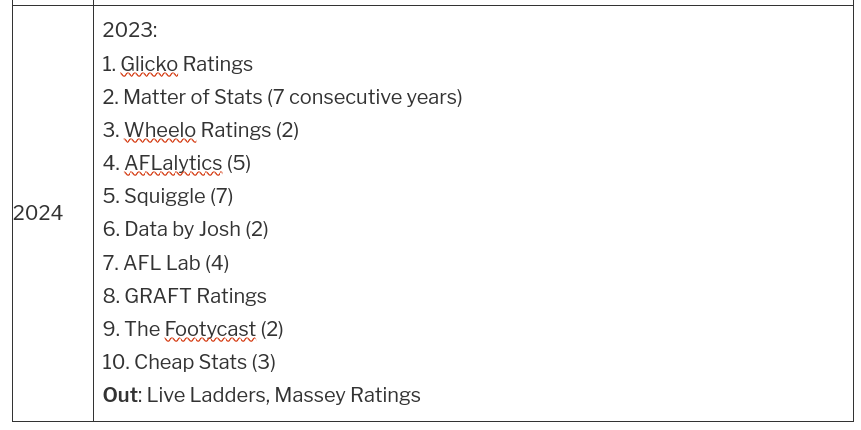
@AflGlicko and @GRAFTRatings re-enter the index, @MatterOfStats & the Squiggle in-house model make it 7 in a row, and @AflLadder misses for the first time since joining in 2018.
For the fifth consecutive year, Squiggle carefully recorded all public preseason ladder predictions made by experts and media pundits, and scored how accurate those predictions turned out to be.
Not all well-known media names do preseason ladder predictions. In fact, only a minority seem willing to put their name to an actual ladder, as opposed to safer, more vague statements about which teams might rise or fall. This year, we found fifty of them. All should be applauded. But also scored.
Every 2023 Expert Ladder Prediction Rated
Since this is the fifth year, we’ve built a reasonable idea of how reliable people tend to be in the long-term; that is, whether a great prediction this year means that person is likely to come back with another the year after. But before we get to that, here’s how 2023 shook out:
Best ladder: (Tie) Johnathon Horn (The Guardian) & Jon Pierik (The Age)
Horn led for most of the back end of the year, thanks to his faith in Collingwood and Port Adelaide. But Pierik closed in the final round with a ladder that correctly tipped 6 out of 8 finalists, and placed eight teams within a rung of their actual position. There might have been a fair bit of luck, given the closeness of the middle of the pack, and how easily it might have been different. But it was a great ladder. The rating system judges them different but equally good, so Horn and Pierik share the honours.
Best ladder by a model: Squiggle
It was a poor year for models, who went very heavy on Geelong and underestimated Collingwood. None made the top 10, while many fell to the bottom half of the 50 predictions. The best was Squiggle’s own in-house model, which was ranked 14th.
The betting odds weren’t a great guide, either, with an aggregate of where punters were putting their money landing 25th, right in the middle.
Worst ladder: 2022 + Pythagorus
To be fair, this wasn’t Max Laughton’s own prediction (which is ranked 30th). It was, instead, a completely reasonable application of Pythagorean wins to adjust what the 2022 ladder “should” have looked like. But since it was supposed to tell us what the ladder would look like in 2023, too, I included it. And it did badly: worse, in fact, than if no adjustment was performed at all, and we guessed that this year’s ladder would look the same as last year’s.
With only half the Top 8 correct, no team in the exact right spot, and five teams out by at least 8 rungs, it ties with Damien Barrett’s 2019 entry as the worst ladder prediction we’ve recorded.
Long-Term Performance Award
Last year, we lauded Peter Ryan, who over four years maintained an average rank of 8th, including topping the list in 2022. Unfortunately, Ryan had a shocker this year, finishing near the bottom, mostly because of a failure of optimism in Port Adelaide, Carlton, GWS, and St Kilda.
The best long-term performers, counting everyone who made a prediction in at least 3 of the last 5 years, are:
| Average Rank | Expert |
| 10.8 | Squiggle |
| 14.6 | Sam McClure (The Age) |
| 15.4 | Peter Ryan (The Age) |
| 15.6 | Jake Niall (The Age) |
| 16.0 | Riley Beveridge (AFL Media) |
| 16.0 | Nat Edwards (AFL Media) |
| 16.3 | Sarah Olle (AFL Media) |
| 16.3 | Daniel Cherney (The Age) |
| 17.0 | Michael Gleeson (Code Sports) |
| 18.2 | Jon Pierik (The Age) |
Each year there are about 50 expert predictions, so it’s challenging to remain even in the top half on a long-term basis. Or, put another way, ladder predictions seem to be a bit of a crapshoot, with not much evidence that someone who made a good prediction this year will be able to do it again next year.
However…

Squiggle is, frankly, killing it here, outperforming the whole football industry by a significant margin over the tracked period. You can judge for yourself whether this is due to the brilliance of the Squiggle algorithm or the awfulness of the average media ladder prediction. And, to be sure, a big reason for this project was the suspicion that a lot of ladder predictions got tossed around each year by people who didn’t expect anyone to look at them again after March.
Live Running Predictions
Squiggle also tracks ladder predictions made throughout the year by various models, including our own. This year, Squiggle narrowly beat out Glicko Ratings, Matter of Stats, Wheelo Ratings, and AFLalytics.
Welcome to 2023’s first new model: Don’t Blame the Data from data scientist Jason Zivkovic, the author of data management packages worldfootballR, chessR and others.
DBtD is coming out of the gate pretty hard, with some confident early tips and (so far) the only upset tip for the Crows to defeat GWS. Good luck, buddy.

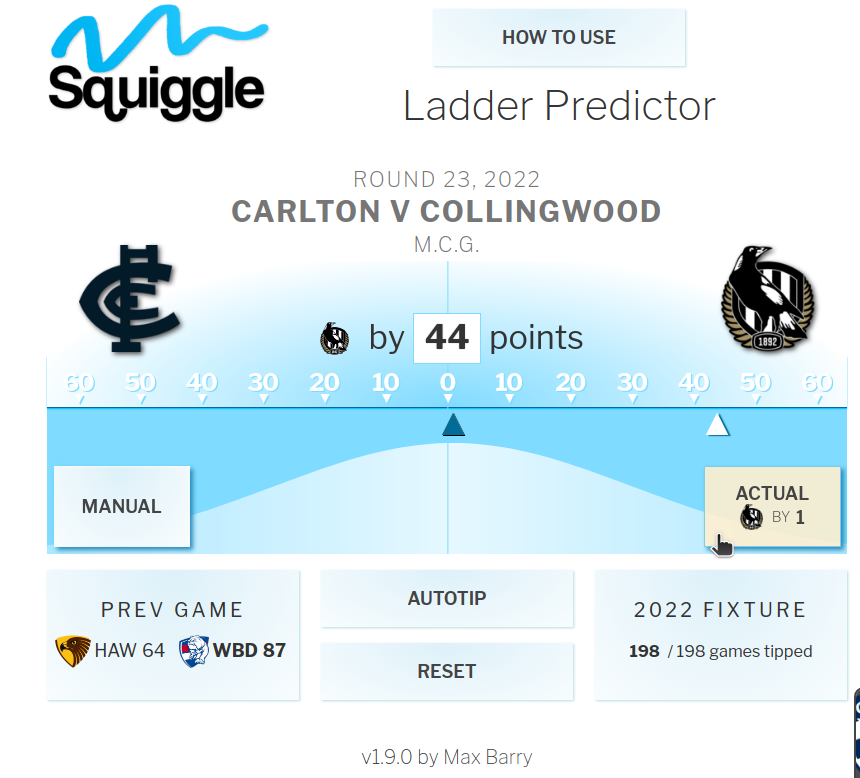
You can now load past years and either click through real results one game at a time, or fill in the whole year with Reset and tweak key results to see what changes.
Load a past season: FIXTURE ➡️ Allow tipping of past games
Progress one real result at a time: keep tapping ACTUAL.
Fill in the whole season: RESET ➡️ RESET TO ACTUAL.
First, the headlines: Geelong had the easiest fixture, GWS the hardest. But before we go any further, an important disclaimer: the Cats were so comfortably in far of everyone else, not even the league’s hardest fixture would have kept them from the minor premiership.
Home advantage is important, but not that important. If home advantage was as important as people say, all the left-column circles would be green and all the right ones would be red:
Games Won & Lost in 2022 (incl finals)
| With Significant Home Advantage | Neutral-ish | With Significant Away Disadvantage | |||
|---|---|---|---|---|---|
1 |  | Geelong | WWWWLWWWWWW | WWWW | WWWLLWWWWL |
2 |  | Sydney | LWWWWWLWWWW | WWW | WLWLLWLWWWL |
3 |  | Brisbane | WWWLLWWWWWWW | W | LWWLWLWWWLLL |
4 |  | Collingwood | WLWWWWLW | WWWWLLWWWWL | LLWWWL |
5 |  | Fremantle | LWWLWLLWWWW | WW | WLLWWWDLWWW |
6 |  | Melbourne | WLLLWL | WLWWWWLLWWW | WWWLWWW |
7 |  | Richmond | WWWWDW | WWLWWLWLLWL | LLWLWL |
8 |  | Bulldogs | WLWWLL | WWLWWWLW | WWLLWLLLL |
9 |  | Carlton | WWWWLW | WLWLWWWLLL | WLWLLL |
10 |  | St Kilda | WLLLW | LLWLWWWLLW | LWLWWLW |
11 |  | Port Adelaide | LLWWWWLWWL | WLWL | LLLLLWLW |
12 |  | Gold Coast | LLWWWLWW | LWW | LLLLLLWLLWW |
13 |  | Hawthorn | WWWWLWW | LLLLLLLLLLLW | LWL |
14 |  | Adelaide | LLLLWLWLWW | WL | LLLWWLLLLW |
15 |  | Essendon | WWWLLL | LWWLLLLLLLW | LLLLW |
16 |  | GWS | LLLLLLWWWW | LL | LLLLLLWWLL |
17 |  | West Coast | LLLLWLLLLL | LL | LWLLLLLLLL |
18 |  | North Melbourne | LLLLLW | LLLLLLLLW | LLLLLLL |
There is a bias there – home advantage is worth something – but it’s not a guaranteed ride to the Top Eight, or even a single extra win. You still actually have to be a good team.
(In the above table, “Significant Home Advantage” means games between interstate teams at a home ground, Geelong playing anyone at Kardinia Park, and Hawthorn or North dragging anyone off to Tassie.)
Of course, there are different degrees of home advantage. In Round 19 alone, we had:
There’s a real hodge-podge of scenarios, which over the season shake out a bit like this:
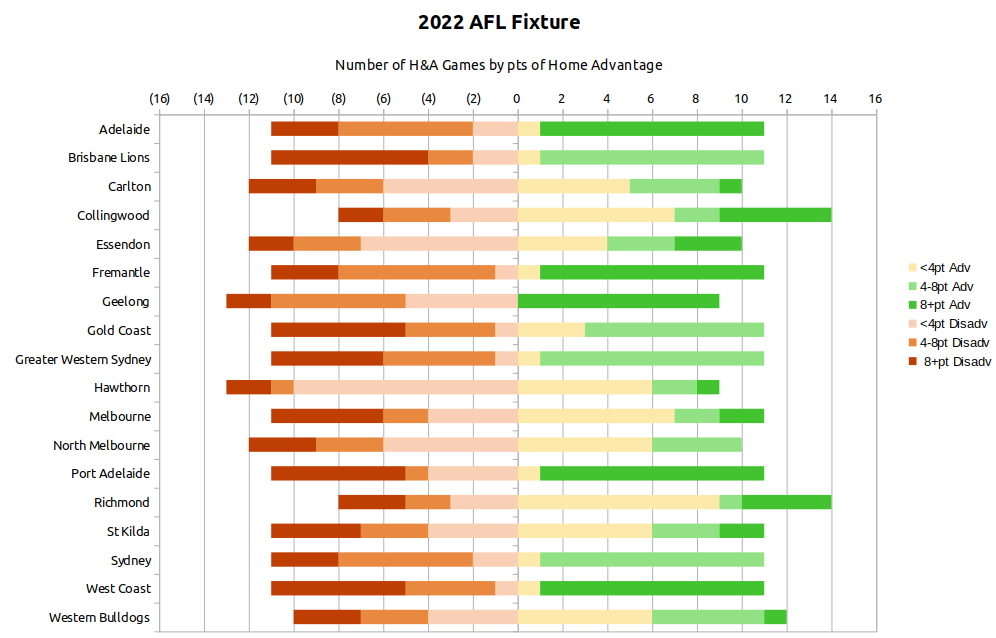
Don’t stare at that too long, though; there’s not much to be gleaned from it. The Squiggle model considers Collingwood and Richmond to enjoy many games of mild home advantage, by virtue of their large crowds at MCG games. The South Australian & West Australian teams usually have 10 games of extreme home advantage but fewer games of extreme disadvantage, as they revisit the same venues repeatedly (especially Docklands). NSW and Queensland teams essentially never create the same level of home advantage as the rest of the league, due to their lack of fan-filled cauldrons. And the Cats have a cauldron as well as warm fan support at many of their away games, which is a pretty handy setup.
Let’s now throw in Opposition Strength, because that’s the other big piece of the puzzle. As you know, each year the AFL carefully divides the previous year’s ladder into blocks of 6 teams, and assigns double-up games based on an equalisation strategy, so that weaker teams receive gentler match-ups.
Ha ha! We know that never works, since it only takes a couple of teams to shoot up or down the ladder to throw the whole thing out. But it may never have worked worse than this year, with Geelong, the eventual premier (and last year’s preliminary finalist) receiving quite gentle double-up games, while back-to-back wooden spooners North Melbourne faced a much sterner test. To some extent, this happens because teams can’t play themselves – you can’t fixture the wooden spooner against the wooden spooner – but still, things have not gone well when the premier has double-up games against the bottom 2 teams (representing 4 wins combined), while the bottom team faces both Grand Finalists, who have 34 wins.
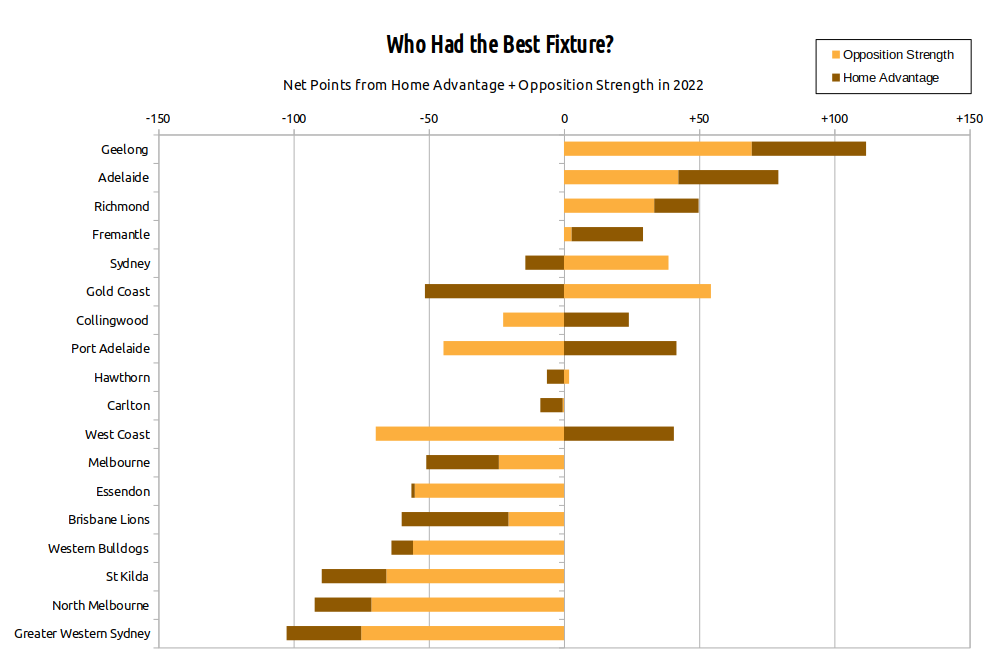
Overall, Adelaide did well out of the 2022 fixture – which, as a bottom-6 team, was at least to plan. Gold Coast, also lowly ranked in 2021, received a terrific set of double-up games, but lost it all to home advantage, as they hosted interstate teams at Carrara only 8 times while flying out 10 times themselves – and not just to familiar Docklands; the Suns were dispatched to every state plus the Northern Territory (twice), and even country Victoria.
St Kilda had terrible everything, as usual; St Kilda always have a terrible fixture, to the point where I’m starting to think it must be written into the AFL constitution. They hosted just 4 interstate teams (at Docklands, which their opponents visit often) while taking 6 interstate trips, including two to Perth, plus a bus to Kardinia. Their five double-up games – which should have been mild, as a middle-6 team – included both Grand Finalists, a Preliminary Finalist, and a Semi-Finalist. This combination of bad luck and bad design is very St Kilda, as was the Round 7 home game the Saints sold to play in Cairns and subsequently lost by a single point: a rare sighting of the case where a team’s unfair fixture really did cost them the match.
GWS also had four finalists in its five double-up games, and its fifth opponent was Carlton, who missed finals by a point. That’s enough for the Giants to take the booby prize for the worst set of match-ups.
Geelong’s bounty, while appreciated, I’m sure, was mostly wasted, since they finished two wins and percentage clear on top of the ladder, and were decidedly the best team in finals as well as the second half of the year in general (after Melbourne’s slide). It’s unlikely their fixture affected anything, and the Cats almost had a case for being dudded, escaping by 3 points against the Tigers in a home game played at the MCG, and by a goal against Collingwood in a home final at the same venue.
The 2023 AFL fixture will be released in the near future, and I have some thoughts. Chief among them: We are not actually achieving much equalization when we focus on the 6-6-6 system – which is obviously flawed and often produces the opposite effect – while ignoring systemic, completely predictable imbalances, such as:
To be fair, the fixture-makers do seem to be aware of most of the above, and I think they make some effort to avoid any of them becoming too egregious. But the priority is clearly the double-up games, which is the least predictable part of the equation. The result is that Docklands teams – especially St Kilda! – are almost guaranteed a bottom-4 fixture every year.
And maybe we can’t fix that; maybe the world isn’t ready for a fixture that provides kinder fixtures to poor teams with smaller fan bases. But it should be part of the conversation. Today, any talk of fixture fairness quickly shifts to how many times each team should play each other, and stops there, as if that’s the whole problem. It’s not: a 17-round fixture (or 34 rounds) won’t stop teams selling games, or being shifted to the MCG to face Richmond and Collingwood, or being sent to country Victoria; or, for that matter, being lucky enough to play a team when they have a bunch of outs versus when they don’t.
It’s a grab-bag of factors, and there’s no way to smooth them all out. Teams will inevitably have good fixtures and bad fixtures. But we can do better if we don’t rest the whole thing on 6-6-6 and the clearly wrong assumption that next year’s ladder will look just the same as today’s.
Oh sure, now, everyone looks back on the preseason ladders and mocks how wrong they were. “Essendon to make finals,” they say, shaking their heads. “Not even close.”
But no-one was close, of course; everyone’s ladder has a howler or two. If you picked Essendon to fall, you probably didn’t also pick Collingwood to rise, or Port Adelaide to miss.
That doesn’t mean they’re all equally bad, though. Here at Squiggle, we value the signal in the noise, even if there’s still a lot of noise. And ladder predictions that were less wrong than everyone else’s are to be celebrated.
Every 2022 Expert Ladder Prediction Rated
Best Ladder: Peter Ryan
This is a heck of a good one, and it’s no flash in the pan:
Ryan’s ladder managed to get 7/8 finalists, which is fantastic given that three of them finished last year in 11th, 12th, and 17th. (His tip of Fremantle for 6th — a single rung too low — was especially good.) Like everyone else, he missed Collingwood, but correctly foresaw exits by Port Adelaide, Essendon and GWS. He also resisted the popular urge to push Geelong down the ladder, and wisely slotted the Eagles into the bottom 4.
Damian Barrett also registered a good ladder this year, with 6/8 finalists and three teams in the exact right spot. There was a fair gap from these two to Jake Niall in third.
Runner-Up: Damian Barrett
Best Ladder by a Model: Squiggle (6th overall)
Squiggle nudged out other models with some optimism on Sydney and pessimism on Port Adelaide, but not enough of the former on Collingwood and not enough of the latter on GWS and the Bulldogs.
Honourable Mention: The Cruncher (11th overall)
Long-Term Performance Award: Peter Ryan
Not everyone publishes a ladder prediction every year — it’s a little shocking how frequently journalists come and go from the industry — so although I always have a bag of 40 or 50 experts and models to rank, only half appear in all four of the years I’ve been doing this. Of those, Peter Ryan has the best record, finishing 19th (out of 45), 9th (/56), 3rd (/42) and 1st (/45). That’s an average rank of 8th, making him the only one to outperform Squiggle over the same period.
Honourable Mention: Squiggle (5th, 20th, 9th, 6th)
Live Running Predictions
Squiggle pipped AFLalytics and Wheelo Ratings on the Ladder Scoreboard this year, mostly thanks to some solid returns in the early rounds.
Throughout the year — but especially early — the teams models overrated the most were GWS and Hawthorn, while they underrated Collingwood and Fremantle.