


I got into football stats because I wanted to understand why my team was so bad for so long and was there any hope for the future or should I just die. That was about 20 years ago. Along the way, I learned that plenty of common football wisdom is probably wrong. Stats people can show it’s wrong, but everyone just keeps repeating it anyway.
So to save you 20 years, if it’s not already too late, these are some of the most useful things I’ve picked up.
Scoring Shots Matter
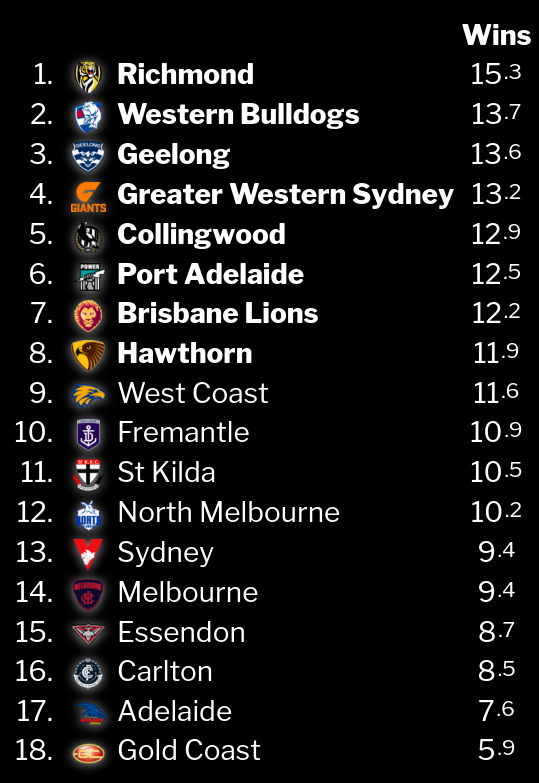
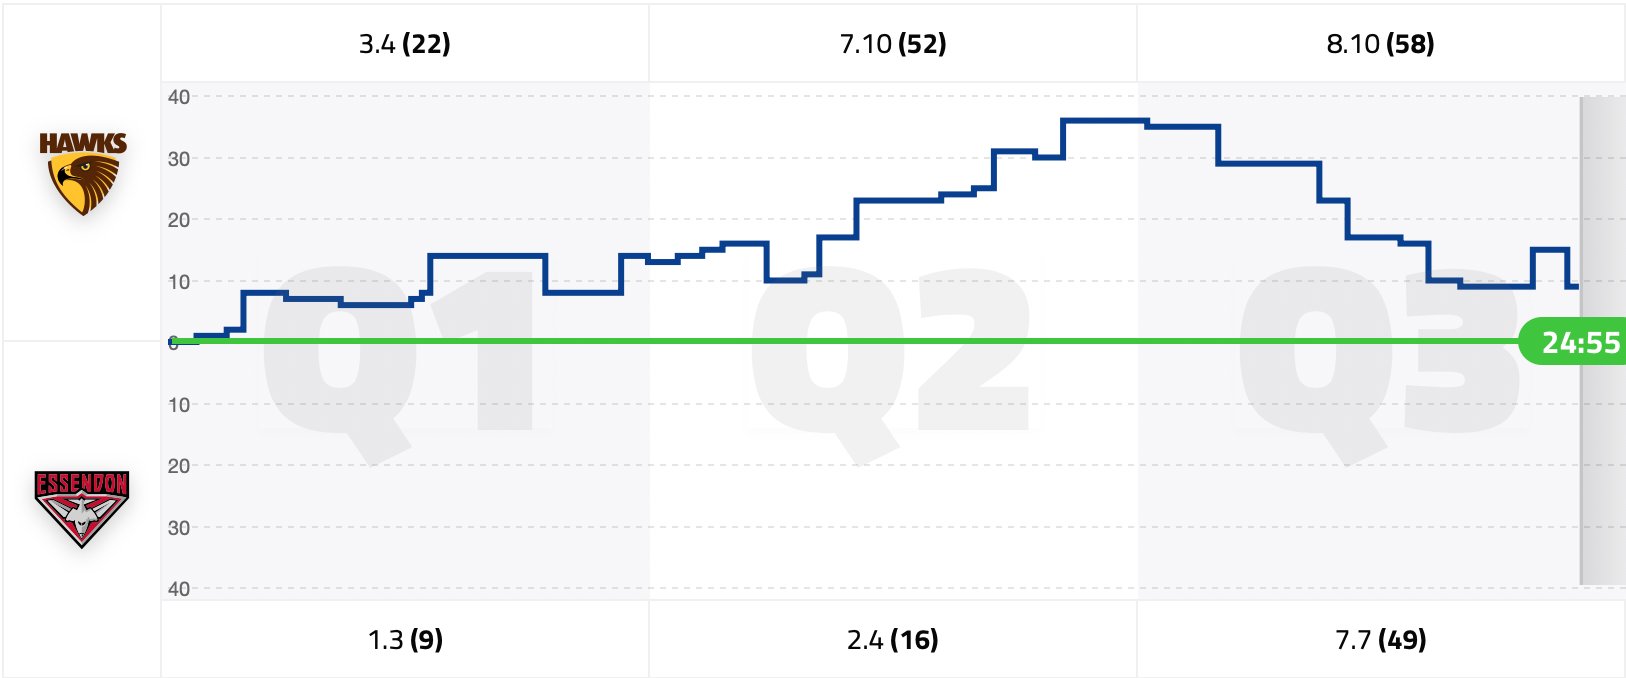
It’s better to be a team that kicks 6.18 (54) than 9.0 (54). People will criticize the former and say bad kicking is bad football, but the truth is that there’s a lot of luck – or at least unpredictability – in goalkicking, no matter who you are. It’s harder to fluke 24 passages of play that move the ball into a scoring position than 9 accurate kicks, so you want to be the team that’s generating lots of chances, even if it’s not taking them. Because, all things being equal, that team will perform better in the future.

Momentum isn’t Really a Thing
Story is a huge part of why we enjoy football, so there’s lots of talk of momentum: of power shifts, and causality, where this thing caused that thing to happen. But momentum is a weak effect at best, and might not exist at all. When a team goes on a run and scores five or six goals in a row, that’s not a dam breaking, where if only the first goal had been stopped, none of the others would have followed. It’s more like flipping a coin a bunch of times and getting a random string of heads or tails.
Close Games are a Toss-Up
When a team puts together a string of close wins (or losses), here come the hot takes on what it means for their culture or mental toughness. And while good teams do win more close games, they also win more not-close games. So, more accurately, they just win more.
And when the streak of close wins is broken, it vanishes without a trace – again, just as if it were the result of random chance.

There is No Rack
Common wisdom says teams put the cue in the rack once a game is won, so might let through a few junk time goals that don’t really mean anything. A similar piece of common wisdom says teams on the wrong end of a belting drop their heads and so also let through late goals that don’t mean much. These ideas contradict each other.
In fact, nothing special seems to happen in junk time at all. Late scores contribute just as much information about future team performance as any other. So, in reality, better teams win by greater margins no matter what the clock shows when they score.
There isn’t Much Wood, Either
There’s that one team. The bunny. No matter how badly things are going, you always beat them. At least, at a particular venue. You can count the streak going back years and years, even to when none of the players or coaches were the same.
There might be times when one team matches up particularly well on another, or when psychological factors are in play, but with 18 teams and 30 distinct venues, you would expect to find long win streaks even if every match were randomly decided.
And once you permit some wiggle room – e.g. “X have beaten Y in 4 out of the last 5 games at venue Z” – it’s even easier to find an interesting but meaningless stat.
Home Advantage is Probably About Crowds
Home advantage is definitely a thing. But people attribute it to a lot of different factors – especially travel distance and ground shape – that there isn’t much evidence for. But there is reason to believe that if you dominate a stadium with your team’s fans, it will exhibit home ground advantage, no matter who travelled where. The main vector is likely to be social pressure on umpiring decisions.
Travel is a burden, to be sure, and generates physical and logistical challenges that teams have to manage. But its effect on game-day performance seems small enough to be hard to detect at all. This is probably why a 50-minute drive to Geelong depresses the performance of Melbourne-based teams more than a flight to Queensland.
Also Home Advantage is Not Everything
At its strongest, home advantage is probably worth somewhere around two goals. Which is nothing to sneeze at. But usually it’s less. And the world’s best football tipper will struggle to reliably get within four goals of a game’s actual margin, which gives you some idea of the room for error here. So home grounds aren’t quite the unbreachable fortresses that people like to think.
Also, across a season, the home advantage games of teams are so well balanced by their away disadvantage games that the difference is rarely worth getting worked up about. With the exception of 2020, you wouldn’t normally expect any team to win or lose even one whole extra game based on its fixtured home advantage.
When considering who to tip between two evenly-matched teams, it’s logical to lean toward the home team, because they really do win more often. But that doesn’t make it anything like a sure thing.
Beware the Bye, Not the Short Break
It makes intuitive sense that a team with fewer days’ break between games than their opposition is at a disadvantage. And, like travel, it’s obviously something you’d avoid if you could. But there isn’t much evidence that a day or two’s less rest than your opponent makes you win any less.
There is, however, a reasonable case to be made for the Killer Bye – the increased likelihood of poor performance following a much longer break than your opponent. And not just if you’re wearing blue hoops.
There is a Lot of Unpredictability in Football
Firstly, people aren’t great at understanding probability:
| Actual Chance | What People Hear, Apparently |
| 50% | 50% |
| 50.1% | 60% |
| 60% | 90% |
| 90% | 100% |
Also, good tippers get somewhere around 6/9 correct in the long term. So do average tippers. For many people, the number of tips you get right in a year depends on how predictable that year turns out to be, how lucky you are, and how much you know about football, in that order.
So while some people are better tippers than others – and the market as a whole is better than all of them – the difference can be hard to detect, especially within a single season.
What this really means, though, is that there’s always a chance. No matter how terrible your team and how numerous or confident the people tipping against them, there is always a pretty good chance that those people are wrong. And thank God, you know, because who wants football to be that predictable?