
First new model for 2020 is an AFL Gadget-type Operator! Read about this BT-inspired model at https://aflgo.org/ and follow AFL_GO on Twitter.
First new model for 2020 is an AFL Gadget-type Operator! Read about this BT-inspired model at https://aflgo.org/ and follow AFL_GO on Twitter.
If you want to do your own football analysis today – write an article, create a chart, build a neat online tool – you can’t legitimately acquire the most basic stats about AFL matches, not even the scores.
You can manually browse to a website and eyeball the scores. But these pages have Terms of Use that prohibit any downloading or reuse of content, like this one linked from AFL.com.au:
The Copyright Act 1968 (Cth) protects materials such as films, music, books and computer programs. You can break the law if you download, copy, share or distribute this material, unless you’re allowed to do so by the Copyright Act or you have the copyright owner’s permission. Please don’t use our services to do any of these things, because if you do, we might have to cancel your services (including your email count) and the copyright owner could take legal action against you.
In practice, small operators – armchair analysts and independent sites – either laboriously compile these stats themselves, or else ignore the Terms of Use and write programs to download them from somewhere else anyway. Not everyone can do this, though, and for those who can, it can be tedious and time-consuming, as whenever the website updates its format, the scraper stops working or begins pulling corrupt data. And sometimes the source just plain disappears.
The AFL could and should create an API: a simple online interface that publicly serves up very basic football data such as match scores in a computer-readable format. It could do this simply, cheaply, and without exposing any advanced stats that Champion Data rightly consider to be proprietary and valuable.
This would:
Today there are excellent free APIs for practically all major world sports, except AFL. There are dozens for cricket and rugby, and hundreds for soccer. In the US, you can’t move for tripping over a baseball, basketball, or football API. But for AFL: nothing.
Regardless of where you land in the wider debate over exactly which stats should or shouldn’t be kept secret, surely no-one is being served when basic match scores are kept under legal lock and key. Fixing this could create a platform for analytics innovation, discussion, and expansion.
Please, Santa?
Here is a 12-tweet thread about the Ladder Scoreboard that I introduced this year, which tracks the accuracy of models’ weekly ladder projections.
With the home & away season tucked away, it’s time to look back and see whether all those preseason predictions that were floating around earlier in the year turned out to be prescient… or putrid.
It’s time for the Squigglies 2019! (Home & Away edition)
Every Expert Preseason Ladder Rated
Head and shoulders above the rest, AFL Lab correctly tipped Geelong for the minor premiership and Sydney to finish bottom 4. It was one of few ladders to resist the temptation to fit Adelaide into the Top 8. While, like every ladder, it had Melbourne much too high (3rd) and Brisbane much too low (12th), it is otherwise excellent, with no fewer than 13 teams tipped within 1 rung of their actual position. Score: 71.5
In March, AFL.com.au gushed forth ladder predictions from no fewer than 15 journos. One of them was the only prediction to squeeze a computer model out of the top 5: Paul Bastin’s. Paul was bullish on Brisbane (8th) and bearish on Sydney (14th), but done in by his faith in Adelaide (3rd) and lack thereof in the Bulldogs (15th). Score: 67.7
Runner-up: Nat Edwards (65.5)
A few media outlets ran preseason fan surveys, drawing on the wisdom of the crowd to compile ladder predictions. Some crowds were more prescient than others. The best was from AFL.com.au, which finished 6th overall, beating out every single expert from the media but Paul Bastin. Score: 66.7
Of other crowd-sourced predictions, The Roar and The Age were also better than most pundits. Reddit r/AFL’s attempt, however, was only marginally better than taking the 2018 ladder and guessing it would be the same again.
Runner-up: The Roar readers (63.3)
Look, predicting the ladder is hard. It makes fools of us all. Unfortunately, someone has to be last, and this year it’s Damien Barrett, who tipped Adelaide for the minor premiership and Fremantle to storm into finals, alongside Sydney and Melbourne. Damien didn’t have enough faith in Brisbane (15th) or the Bulldogs (14th), and expected Geelong to slide out of finals contention. With only one of the top four correct (Richmond), half of the top eight missing, and ten teams wrong by three or more rungs, it’s a shocker. Score: 50.4
You’re an intelligent person, probably, with opinions about football teams. Occasionally you might want to employ those qualities to predict what the ladder will look like at the end of the year.
So how, exactly, does someone do that? What is the ideal process?
The answer, my friend, is a journey through madness and despair. The first step is stupid, yet with each successive step, it somehow gets worse.
Let me walk you through it.
Sure. Anyone can do that. Your ladder looks reasonable, but you’re not even properly considering the fixture. What about teams that have an easy or hard run home?
There we go. You have now accounted for fixture bias. And you have a ladder with… wait, Geelong on 20 wins. They’re good, but that seems ambitious. How did that happen?
Oh, of course! You didn’t tip upsets. In reality, favourites lose about 30% of the time.
Now things look more realistic. Geelong have 16.5 wins. You threw in a draw because you couldn’t bring yourself to say they’d lose to Sydney. You don’t actually expect that game to be a draw, of course. In fact, you don’t really expect most of your upsets to come true. That’s why they’re upsets: they’re unlikely by definition.
So… now your ladder is based on results even you don’t believe in. Uh.
All right. Time to piss off the ladder predictor and get serious. What you’re doing now is going through each game and awarding a percentage of a win to each team based on how likely it is. Collingwood are a 60% chance to beat North Melbourne, so that’s 0.6 wins to the Pies and 0.4 wins to North.
This is better. You’ve successfully accounted for the likelihood of upsets, without having to guess exactly when they will occur. You just averaged the possibility of them over the course of the season. Smart.
So let’s see. You now have Collingwood on 14.2 wins total, and right behind them, GWS on 14.1 with a much healthier percentage. Hmm. So you’re basically forecasting each team to win 14 games, and for GWS to have a better percentage, but for the Pies to finish above them.
Shit.
No-one wins 14.2 games! You can’t win a fraction of a game! What your number really means is that Collingwood will win about 14 games while leaning toward more rather than fewer. So if you round everything off, it works. Collingwood: 14 wins. GWS: 14 wins. Percentage comes into play. GWS go higher. Done.
Except… further down there’s North Melbourne on 10.5 wins and Essendon on 10.4. They’re almost identical, but you have to round them in different directions. That puts North one whole win ahead of Essendon. Well, that’s probably still okay. I mean, they’re still in the right order. And your numbers really do have North closer to 11 and Essendon closer to 10. So they’re rounded. Moving on.
Next is Fremantle on 9.5 wins with a better percentage than Essendon. So… the Dockers… also… round to… 10 wins… and move above the Bombers.
Now the rounding is messing with the order. You originally calculated that Essendon and North are in close competition with Fremantle a game behind, but after rounding, you’re putting North clearly ahead with Essendon third of the bunch. That’s not great.
And that’s not all! Look at the shit that transpires when there are two rounds to go! At that point, it’s logically impossible for certain teams to finish in certain spots, because of who plays whom, but your fractional wins are putting them in those spots anyway! What the fuck!
You know what you need? A FUCKING COMPUTER. You can’t do all this shit on paper and spreadsheets. You need to write a GOD DAMN PROGRAM to run through every single game and roll a die or whatever a computer does to pick a random number. Then, because it can calculate footy stats all day and not get asked to take the dog for a walk or fix the wobbly chair, it can do that TENS OF THOUSANDS OF TIMES.
All right. All right. You now have a simulation that can figure out the likelihood that percentage comes into play when deciding ladder positions. You still have to average out finish placings, so have the same issue with occasionally tipping logically impossible placings. Is mode better than mean here? Who knows. It’s an improvement. Moving on.
Wait. Some numbers seem a bit wacky. There might be a bug or two in those hundreds of lines of code you just wrote. Yep. Go fix those.
And while you’re poking around, ask yourself: Does the language you used employ a half-arsed random number generator that prioritizes speed over correctness, which completely falls apart when you call it forty thousand times per minute? Well shit! Yes it does! Now you’re reading the documentation, you see that for actual randomness, you need to use a special module with an interface written in Russian! And don’t forget to ensure your machine has an adequate source of entropy! What the hell is entropy? Where do I get that from? The entropy shop?
This simulator seems pretty damn sure of itself, you have to say. You fixed its bugs and gave it all the entropy it could desire, but this thing insists there’s no way a low-ranked team could ever make a late run for the finals. It’s guaranteeing Geelong top spot even though they’re only two games ahead with half a season to play.
It’s overconfident. It’s treating each match as an independent random event, but you know that if Fyfe’s knee blows out, Fremantle’s results will start looking pretty goddamn dependent. You need to simulate the chance that each team can get fundamentally better or worse as the season progresses. How do you do that? Oh, the experts disagree. Super, super.
You did it. You created a full-bore simulator made from belted-together hunks of stolen code and occasionally you discover a horrifyingly fundamental bug but god damn it, it works. It mostly works.
Of course, you had to make a lot of design decisions along the way. You’re maybe not a hundred percent confident in all of those choices. To test them, you need to run this thing against real-world results, a lot of them. Like decades’ worth. And that requires a method of scoring your ladders’ accuracy. Hmm. There are several different ways of doing that. They’re all complicated.
I’m not sure what happens after this. I’m sure it’s something. This is as far as I’ve made it.
At this point, you can pause, reflect on your efforts, and observe that your ladder predictions are often outperformed by random BigFooty posters employing the eyeball-and-guess method.
God damn it.
Squiggle Ladder Predictor: Predict the final ladder!
Rate My Ladder: Score your prediction!
When you come off a good win, you don’t just want to analyze how great you were compared to the other team; you want to see how great you were compared to ALL the other teams.
Sadly, it’s hard to establish objectively how much better (or worse) Richmond’s defeat of Hawthorn was to Collingwood’s thumping of St Kilda, for example, or any of the round’s other games.
Until now! Squiggle now offers an algorithmic ranking of who had the best round. Using data from the aggregate Projected Ladder, which brings together the predictions of many different excellent AFL prediction models, this determines how the weekend’s results impacted each team, by comparing how their predicted ladder finishes changed.
This is all based on pre-round expectations, so an upset win can be hugely meaningful for a team, radically improving its prospects of finishing higher on the ladder. Equally, a shock loss can be catastrophic, as the cold-hearted computer models begin shaving down its finals chances.
The importance of “eight-point games” is clearly visible, too, where teams that defeat an opponent competing for the same ladder spots are recognized both for advancing their own position and damaging their competitor’s.
To have an outstanding weekend outside of “eight-point games,” teams need to rely on other results falling fortuitously, so that teams around them lose, while teams too far above or below to matter win.
The current algorithm is a bit experimental, since it applies a weighting to decide the relative importance of changes in predicted ranks vs wins vs percentage. It also applies its own ideas in determining how much to scale these based on the predicted “closeness” of teams, and therefore who is competing with whom for which spots. So it’s currently in beta.
But I think it offers a pretty good map of the round, allowing a peek into the changing fortunes of each team, as prognosticated by the internet’s finest models.
In the same way that Squiggle Dials aggregate predictions from the internet’s best AFL computer models, so does the new auto-updating aggregate Projected Ladder!
As I write (post-Round 6), it looks like this:
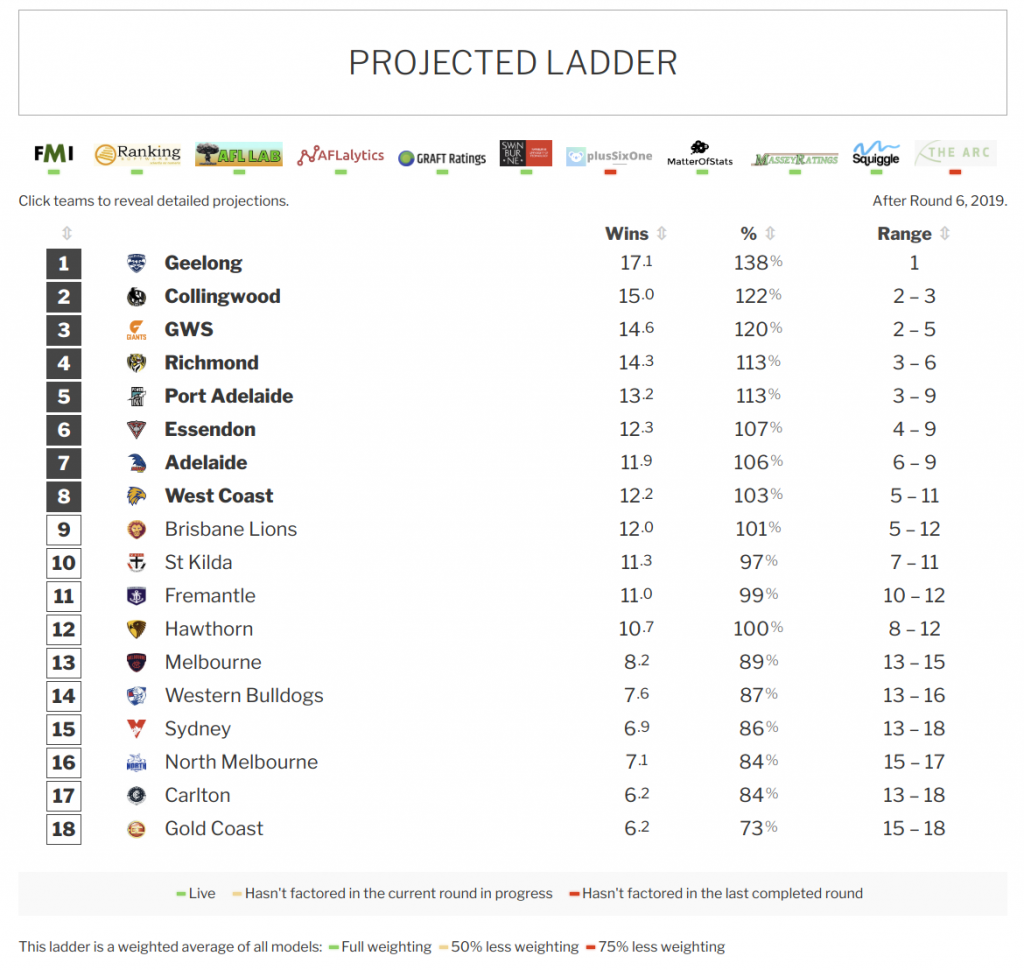
There are some funny quirks to projected ladders, which are quite a bit weirder than they first appear. You can read some discussion of that at the bottom of that page, but the fundamental question is: What are we trying to predict? It’s not at all clear how we should rate the accuracy of a ladder prediction — for example, is it more valuable to correctly tip who finishes 1st than who finishes 12th? How much better? How do you score a ladder that gets the ranks right but had the number of wins all wrong, compared to one that was very close on wins but had some incorrect ranks?
It’s worth noting also that a ladder prediction is not the best way to answer questions like, “What are the chances that my team makes finals?” You can find those kinds of estimates from many Squiggle-friendly models, including FMI‘s Swarms, Graft‘s Projection Boxes and PlusSixOne‘s Finishing Positions. They aren’t aggregated here, but are better targeted to those kinds of questions.
In the background, the Projected Ladder is recording the ladder predictions of each contributing model, so in the future it should be possible to go back and see how they evolved. We could even score them on how accurate they were — once we establish what it is, exactly, that we want to score.
Speaking for myself, I’m pretty sure that my Live Squiggle ladder predictions are quite a lot less intelligent than my game tips, simply because there isn’t a clear way to rate it, which makes it more difficult to refine and improve. A standard metric of some kind would help.
If you’d like to play around with this data, it’s available in a machine-readable format via the Squiggle API!
There’s a terrific new podcast on sports analytics available from Robert Nguyen, author of the site Analysis of AFL and co-creator of the very popular R data package fitzRoy.
All the episodes are worth your time, but this one features me talking about the torment of Richmond fans and the genesis of Squiggle:
You can find it on iTunes Podcasts by searching for “Chilling With Charlie,” or via this link.
One more model sneaks in ahead of the season! It’s Fat Stats, with a machine learning-based player metric model incorporating Elo.

That brings the number of new models to four, and the total field to 16 this year, including Punters, which is our aggregate of bookies.
That’s a lot of models! It’s double the number from only two years ago, and many (most?) are now player-aware, which means they take into account who’s actually taking the field each week, rather than modeling teams as a single entity.