Models Leaderboard After Home & Away

2017 has been a rough year for tipping, even tougher than 2016, which itself was a wake-up call after the lovely, predictable Hawthorn dynasty.

Sadly, none of the models managed to outperform the bookies in tipping winners head-to-head during the Home & Away season, nor in terms of probabilistic Bits.

Tips Bits MAE Correct
Punters

4 8 4 7 7 6 3 5 5 7 4 4 3 7 5 5 7 6 6 9 8 7 5

132 22.1970 66.7%
PlusSixOne

5 8 4 7 6 6 3 5 6 7 3 3 2 8 5 7 7 5 6 5 8 7 6

129 17.9055 28.89 65.2%

5 9 4 6 7 6 3 5 4 7 4 3 2 6 5 5 6 7 7 8 6 6 7

128 17.5804 64.6%

3 8 5 6 7 7 4 5 4 7 4 1 3 6 4 6 8 7 7 8 6 6 6

128 16.3202 28.87 64.6%

5 7 5 6 6 6 4 5 7 7 3 2 3 7 3 5 7 5 7 7 7 7 7

128 15.4157 30.11 64.6%
Aggregate

5 8 4 6 7 6 3 5 5 7 3 3 2 6 4 5 7 6 7 8 7 6 5

125 20.1305 28.92 63.1%

5 7 5 6 6 6 3 5 5 7 3 3 3 6 4 6 7 6 6 7 7 6 6

125 16.5200 29.03 63.1%

4 7 4 6 7 6 3 5 5 7 4 3 2 6 3 5 6 6 7 8 8 6 5

123 18.6520 28.73 62.1%

5 8 5 5 5 6 3 5 5 8 4 2 2 7 3 6 7 6 6 7 6 5 6

122 17.0455 29.79 61.6%

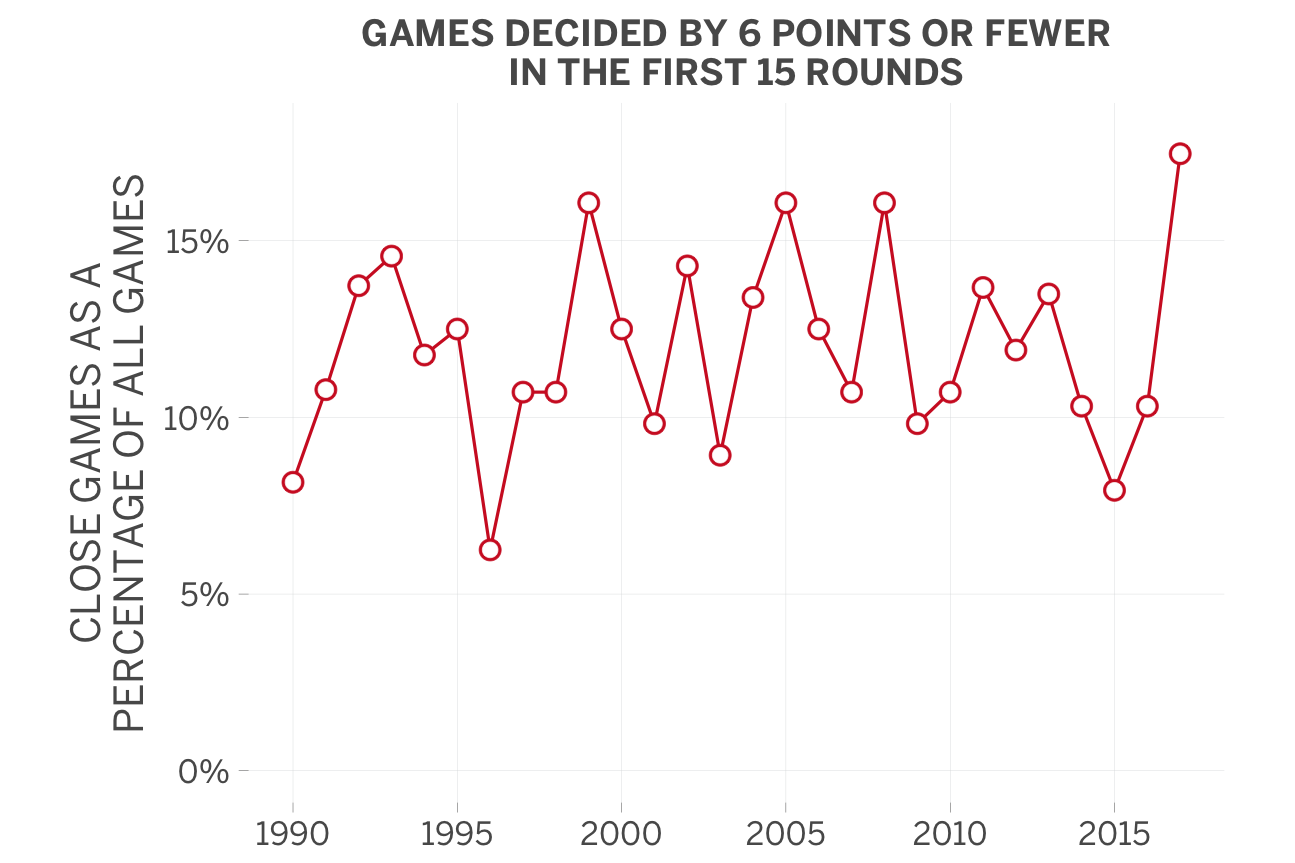
A particularly rough year for Squiggle’s in-house tipping algorithm, which came in dead last and didn’t deserve to be any higher. But very credible performances elsewhere, especially from Plus Six One (for the second year in a row), and it’s worth noting The Arc‘s chart-topping Mean Average Error in a year when the line-ball games didn’t fall their way.

I was curious this year to see what kind of performance the Aggregate would have, where it represents a simple average of everyone else’s tips. Would there be some kind of wisdom of the crowds effect, where it could outperform most of the individual models that provided its inputs? Well, kind of: It landed mid-table in terms of tips and MAE, but with more Bits than all models. So there could be something there.
Apologies for finals tipping being a little shaky at the moment: Apparently everyone (including Squiggle) uses different formatting for posting their finals tips, and squiggle-bot needs to learn how to parse it.

Tip Leaderboard after Round 17

The Tip Leaderboard has developed a bit of spread over the last few weeks! PlusSixOne has pulled away to a whopping four tips lead over the next best model, and it’s leading in Bits as well:

Tips Bits
PlusSixOne

5 8 4 7 6 6 3 5 6 7 3 3 2 8 5 7 7

92 9.5796
Punters

4 8 4 7 7 6 3 5 5 7 4 4 3 7 5 5 7

91 8.0603

5 7 5 6 6 6 4 5 7 7 3 2 3 7 3 5 7

88 3.6086

3 8 5 6 7 7 4 5 4 7 4 1 3 6 4 6 8

88 2.7082

5 7 5 6 6 6 3 5 5 7 3 3 3 6 4 6 7

87 4.6444

5 9 4 6 7 6 3 5 4 7 4 3 2 6 5 5 6

87 4.0108
Aggregate

5 8 4 6 7 6 3 5 5 7 3 3 2 6 4 5 7

86 7.3906

5 8 5 5 5 6 3 5 5 8 4 2 2 7 3 6 7

86 4.1921

4 7 4 6 7 6 3 5 5 7 4 3 2 6 3 5 6

83 6.1518

“Bits” from Monash University Probabilistic Footy Tipping rewards tipsters for saying a win was likely and punishes them for saying it was unlikely.

New to Squiggle is Graft Ratings! Head on over for beautiful tips and projections of all kinds. Graft is having what appears to be a typical model year so far, sitting solidly in the 86-88 tip bracket.

And The Arc can be justifiably feeling a little screwed, with the worst tip numbers despite very respectable Bits and MAE (stats available on the main leaderboard page).

Sydney’s path to the finals may be the weirdest ever

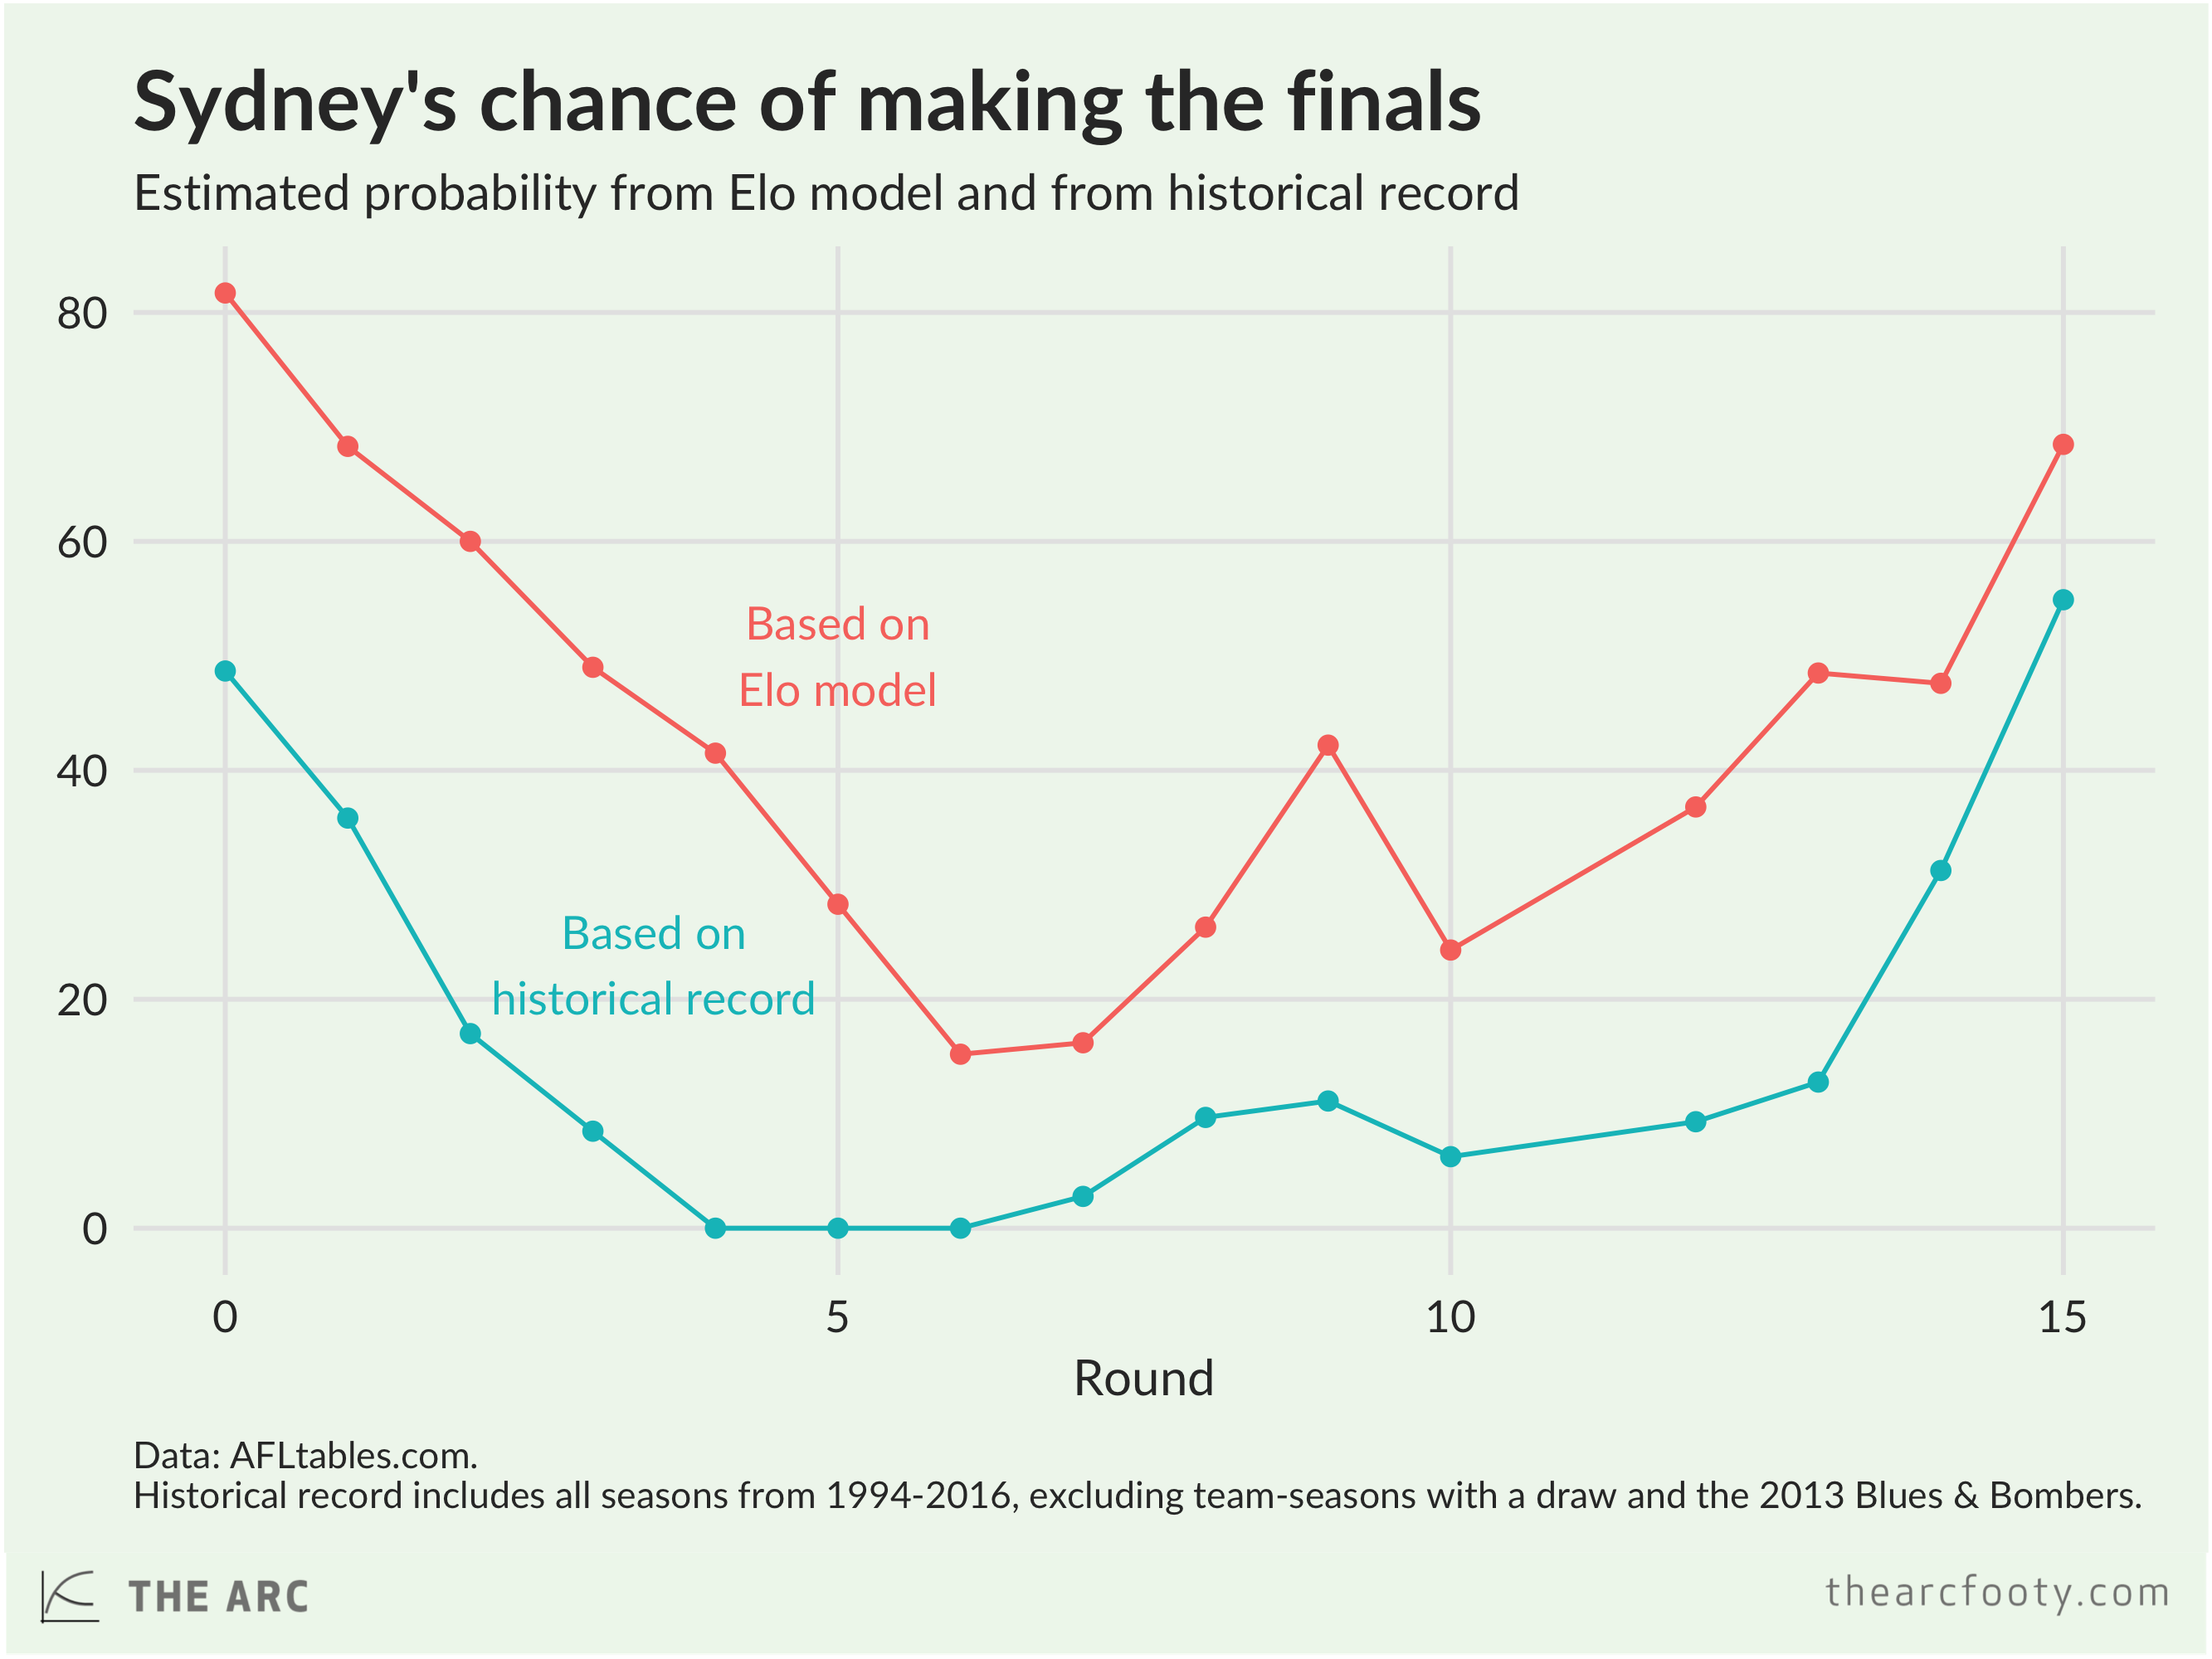
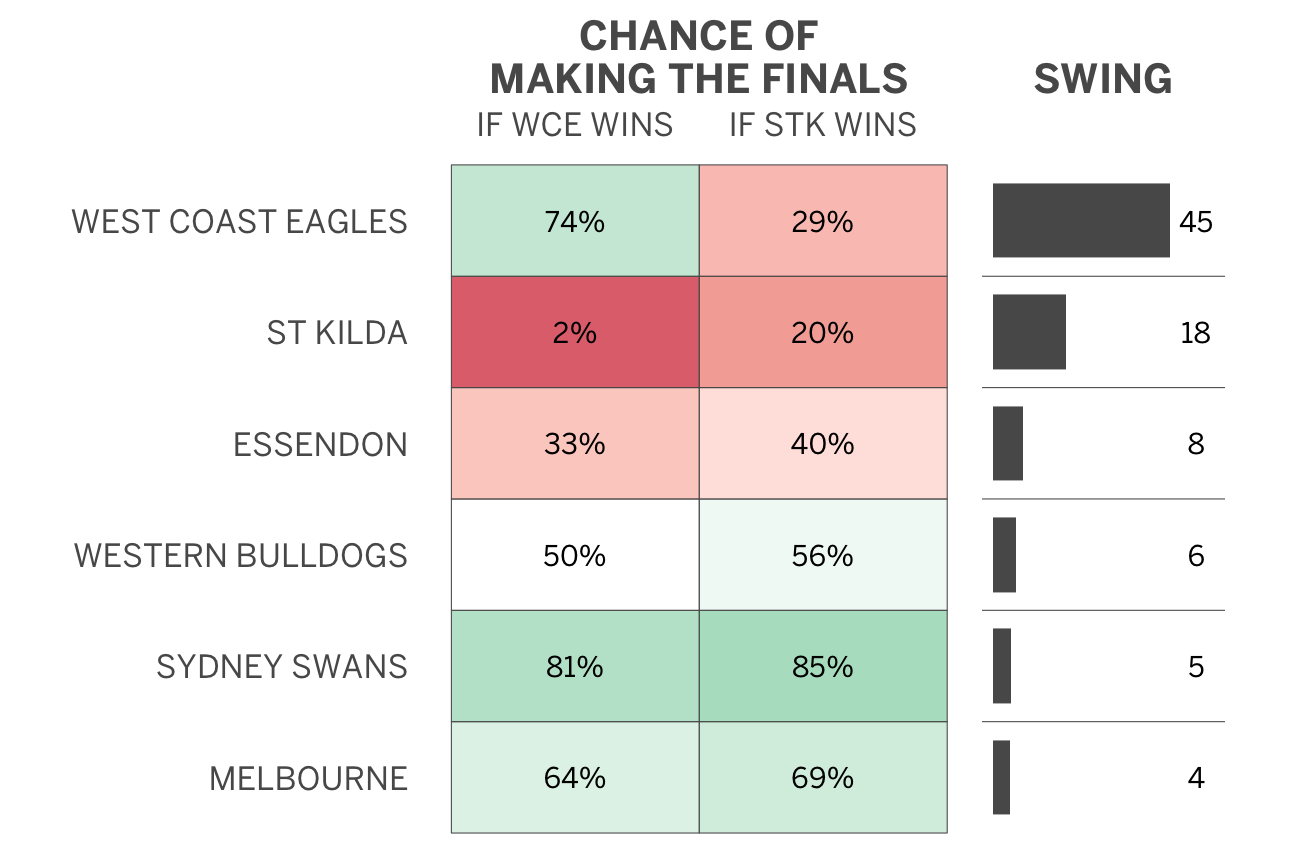
The Arc on the fall and rise of Sydney in 2017.  The Swans are one thing the models got right this year: they never looked that bad, even at 0-6.

No team has ever made the finals after losing their first four games of the season, at least not in the period since 1994 when the AFL has had a top eight finals system. The 2017 Sydney Swans didn’t just lose their first four games – they dropped their first six. Given the historical record, the Swans should have no shot at the finals this year, but they’ve clawed their way back into contention.

Source: Sydney’s path to the finals | The Arc

Killer Byes

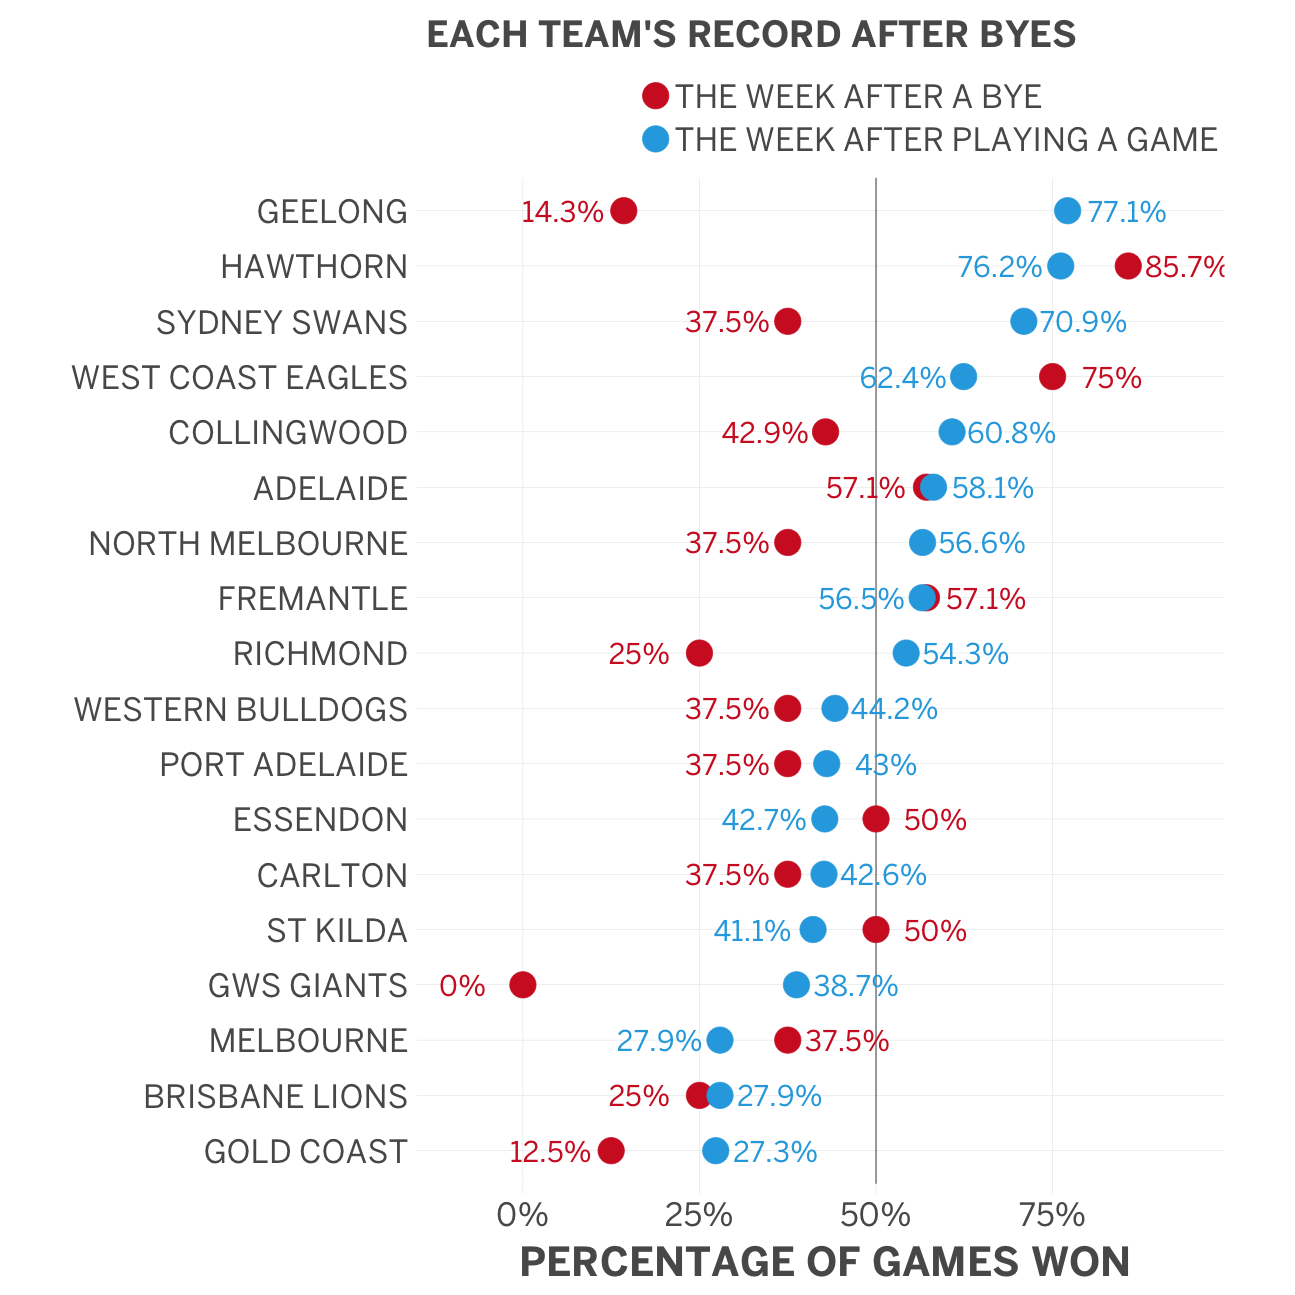
I’m old enough to remember the last time the AFL had regular byes, back in 1991-1994 when the entry of Adelaide made for an odd number of teams. It was popularly known as “the Killer Bye,” because everyone lost after their week off.

Matt Cowgill of The Arc concludes that nothing is different this time around:

A week off can help heal battered bodies, but AFL teams surprisingly don’t seem to do better after the bye.

Source: AFL Footy Forensics Matt Cowgill on the effects of the byes

Footy Forensics: Adelaide to GWS

Matt Cowgill of The Arc has been publishing fantastic analysis on his own site for ages. This year he’s been picked up by ESPN. I feel like every major newspaper and sports site will have their own legit stats person pretty soon. But for now it’s this:

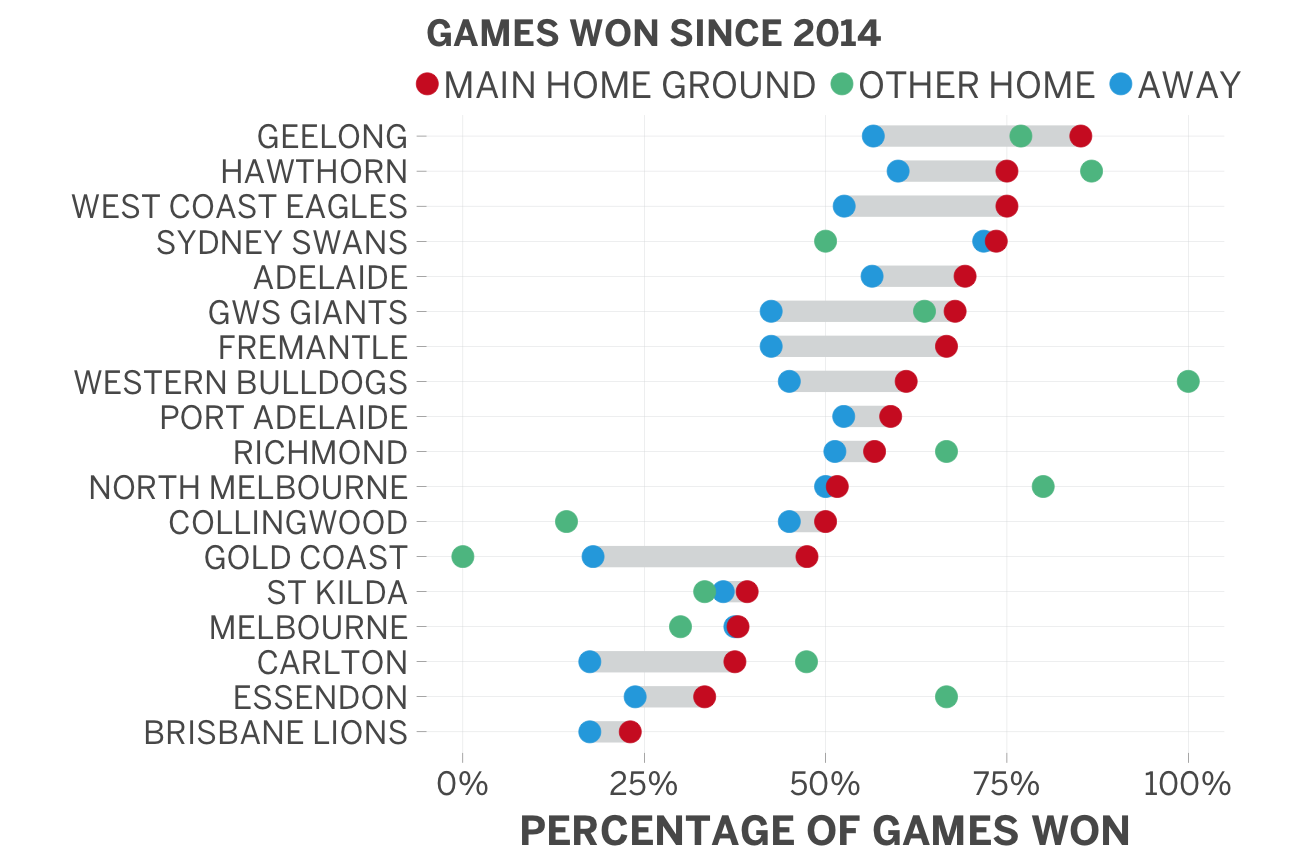
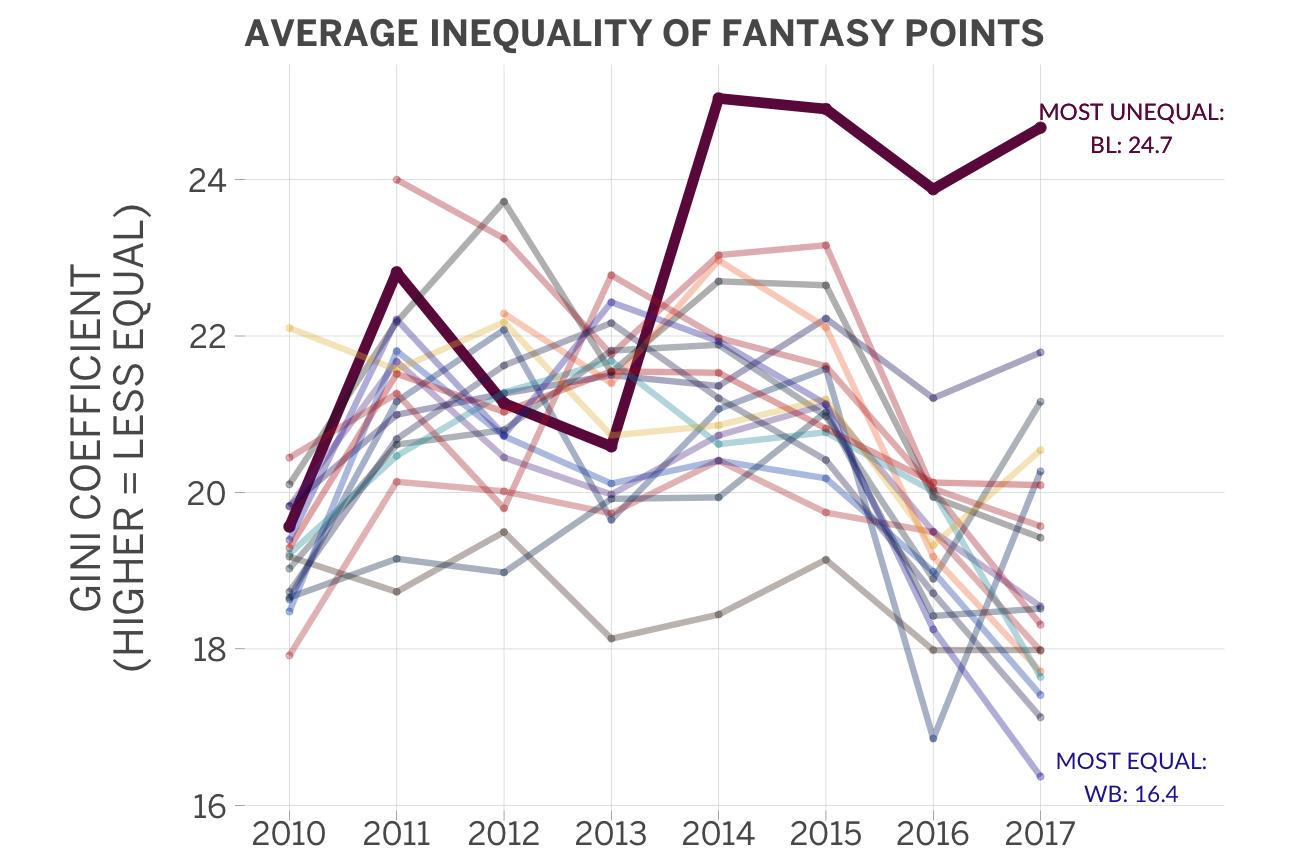
There are a lot of stories buried in footy stats. We’ve combed through the numbers to find something notable about each team – their style of play, or their dominance of a part of the ground, or the way they share the ball around.

This week, we analyse Adelaide through to GWS.

Source: Footy Forensics Your AFL club’s key game trend