Skip to content
Squiggle
@squiggle.au @SquiggleAFL Discord

Footy Forensics: Hawthorn to Western Bulldogs

Posted on June 1, 2017 by Max Barry

Don’t miss Part 2 of Matt Cowgill’s amazing graphgasm smorgasbord over at ESPN:

A deep dive into footy data turns up the graph that tells your team’s story so far in 2017. This week, we analyse Hawthorn through to the Western Bulldogs.

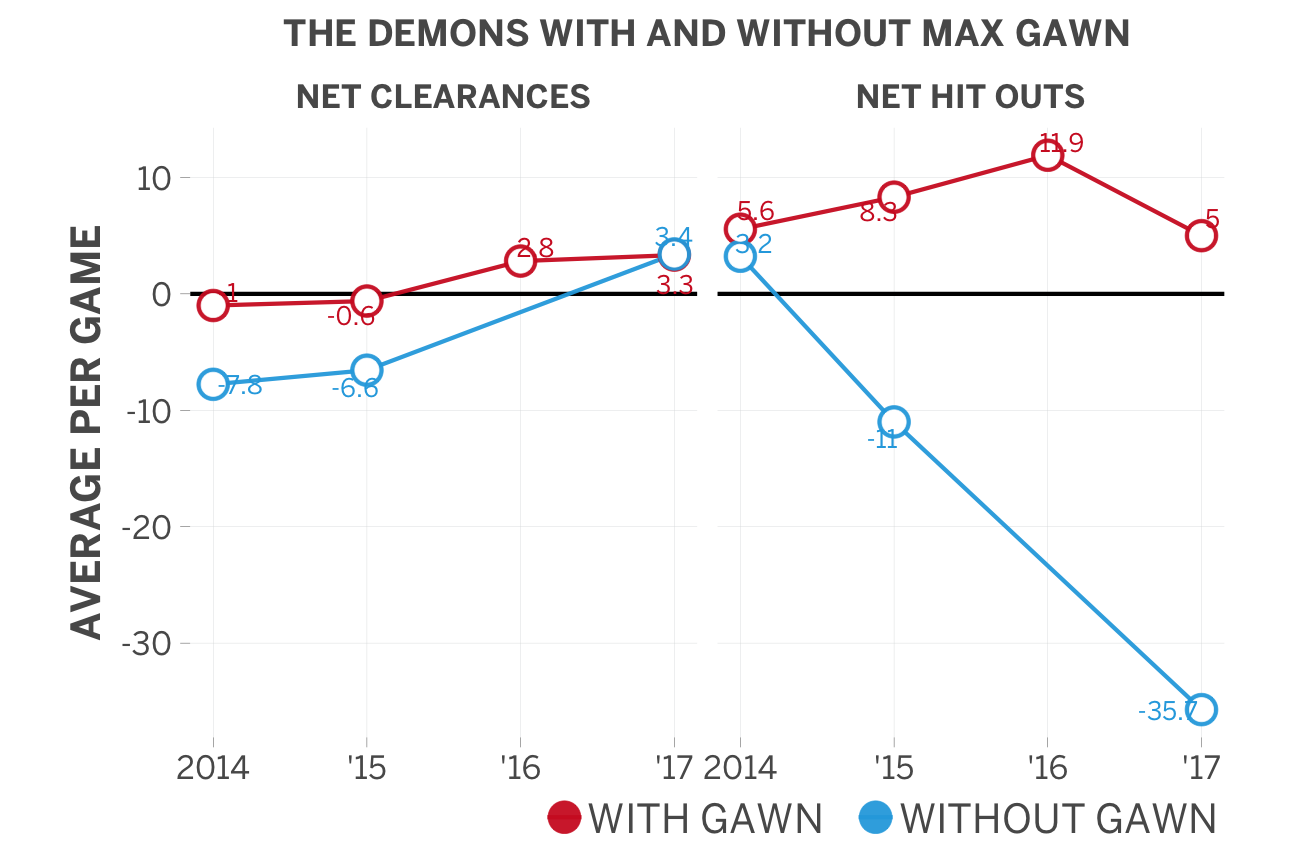
Source: Footy Forensics Your AFL club’s key game trend part II

CategoriesUncategorized TagsThe Arc

Post navigation

Previous PostPrevious Squiggle on Round 10
Next PostNext Are West Coast too Dependent on Kennedy?

Wins % Range
1
Western Bulldogs 16.6 130%
1
2
3
4
5
6
7
8
9
10
11
12
13
14
15
16
17
18
1–2
2
Hawthorn 15.1 124%
1
2
3
4
5
6
7
8
9
10
11
12
13
14
15
16
17
18
1–7
3
Gold Coast 15.1 124%
1
2
3
4
5
6
7
8
9
10
11
12
13
14
15
16
17
18
2–6
4
Geelong 14.8 116%
1
2
3
4
5
6
7
8
9
10
11
12
13
14
15
16
17
18
1–6
5
Brisbane Lions 13.8 117%
1
2
3
4
5
6
7
8
9
10
11
12
13
14
15
16
17
18
2–8
6
Fremantle 13.8 117%
1
2
3
4
5
6
7
8
9
10
11
12
13
14
15
16
17
18
4–7
7
Adelaide 13.3 115%
1
2
3
4
5
6
7
8
9
10
11
12
13
14
15
16
17
18
3–10
8
Sydney 13.2 113%
1
2
3
4
5
6
7
8
9
10
11
12
13
14
15
16
17
18
4–11
9
Collingwood 13.1 109%
1
2
3
4
5
6
7
8
9
10
11
12
13
14
15
16
17
18
6–9
10
GWS 11.3 100%
1
2
3
4
5
6
7
8
9
10
11
12
13
14
15
16
17
18
9–12
11
Melbourne 11.2 96%
1
2
3
4
5
6
7
8
9
10
11
12
13
14
15
16
17
18
9–13
12
St Kilda 10.0 95%
1
2
3
4
5
6
7
8
9
10
11
12
13
14
15
16
17
18
11–16
13
North Melbourne 8.9 85%
1
2
3
4
5
6
7
8
9
10
11
12
13
14
15
16
17
18
11–15
14
Port Adelaide 8.6 88%
1
2
3
4
5
6
7
8
9
10
11
12
13
14
15
16
17
18
13–15
15
Carlton 8.7 84%
1
2
3
4
5
6
7
8
9
10
11
12
13
14
15
16
17
18
12–16
16
West Coast 8.4 79%
1
2
3
4
5
6
7
8
9
10
11
12
13
14
15
16
17
18
12–16
17
Richmond 5.5 70%
1
2
3
4
5
6
7
8
9
10
11
12
13
14
15
16
17
18
17–18
18
Essendon 5.5 71%
1
2
3
4
5
6
7
8
9
10
11
12
13
14
15
16
17
18
17–18

After Round 3, 2026.

PROJECTIONS
W L D % History Wins Finish
1
Gold Coast 3∗ – – 191.0%
+12.1
3
2
Western Bulldogs 3∗ – – 137.2%
+13.6
1
3
Fremantle 2∗ 1 – 143.9%
+11.8
6
4
Sydney 2∗ 1 – 139.5%
+11.2
8
5
Hawthorn 2∗ 1 – 118.1%
+13.1
2
6
North Melbourne 2∗ 1 – 116.6%
+6.9
13
7
Collingwood 2∗ 1 – 114.6%
+11.1
9
8
Melbourne 2∗ 1 – 96.0%
+9.2
11
9
West Coast 2∗ 1 – 87.3%
+6.4
16
10
Geelong 2∗ 1 – 86.7%
+12.8
4
11
Port Adelaide 1∗ 2 – 105.5%
+7.6
14
12
Adelaide 1∗ 2 – 100.0%
+12.3
7
13
Brisbane Lions 1∗ 2 – 94.6%
+12.8
5
14
St Kilda 1 3 – 86.0%
+9.0
12
15
GWS 1 3 – 76.9%
+10.3
10
16
Carlton 1∗ 2 – 72.9%
+7.7
15
17
Essendon –∗ 3 – 61.8%
+5.5
18
18
Richmond –∗ 3 – 56.9%
+5.5
17

∗ Yet to play

Power Rankings

Models Leaderboard

Tips Bits MAE Correct
Holy Grail Ratings

4 8 5 6

23 4.1697 4.17 25.0493 25.05 82.1429 82.1%
What Snoo Thinks

3 8 5 6

22 6.6013 6.60 23.6275 23.63 78.5714 78.6%
Wheelo Ratings

3 7 6 6

22 6.1920 6.19 23.3179 23.32 78.5714 78.6%
Matter of Stats

3 7 5 6

21 7.1933 7.19 23.7554 23.76 75.0000 75.0%
AFLalytics

4 7 5 5

21 6.2387 6.24 24.4121 24.41 75.0000 75.0%
Drop Kick Data

3 7 5 6

21 6.0850 6.08 25.4607 25.46 75.0000 75.0%
footycharts

3 7 5 6

21 5.4688 5.47 24.3114 24.31 75.0000 75.0%
The Wooden Finger

2 8 5 6

21 5.4109 5.41 23.5714 23.57 75.0000 75.0%
HBin

4 7 5 5

21 4.4582 4.46 25.8643 25.86 75.0000 75.0%
Glicko Ratings

3 7 5 5

20 6.6122 6.61 24.8136 24.81 71.4286 71.4%
Don't Blame the Data

2 7 5 6

20 6.5918 6.59 24.3096 24.31 71.4286 71.4%
s10

2 8 5 5

20 6.5138 6.51 24.3104 24.31 71.4286 71.4%
Graft

3 7 4 6

20 5.5894 5.59 24.3214 24.32 71.4286 71.4%
Aggregate

2 7 5 6

20 5.4726 5.47 24.4879 24.49 71.4286 71.4%
ZaphBot

2 7 5 6

20 4.7221 4.72 26.8929 26.89 71.4286 71.4%
AFL Scorigami

3 7 5 5

20 4.7110 4.71 25.5943 25.59 71.4286 71.4%
The Cruncher

2 7 5 5

19 6.9894 6.99 24.7729 24.77 67.8571 67.9%
Stattraction

2 6 5 6

19 5.3229 5.32 24.4479 24.45 67.8571 67.9%
AFL Lab

2 7 4 6

19 4.3223 4.32 26.9814 26.98 67.8571 67.9%
Live Ladders

2 7 5 5

19 4.3022 4.30 26.6429 26.64 67.8571 67.9%
Punters

2 6 4 6

18 5.3755 5.38 24.5643 24.56 64.2857 64.3%
Squiggle

1 7 5 5

18 5.3686 5.37 24.6943 24.69 64.2857 64.3%
Informed Stats

2 7 4 5

18 5.1682 5.17 25.2500 25.25 64.2857 64.3%
The Footycast

2 7 4 5

18 3.8191 3.82 27.2786 27.28 64.2857 64.3%
PlusSixOne

2 7 4 5

18 2.7010 2.70 27.2250 27.23 64.2857 64.3%
Cheap Stats

3 5 3 7

18 1.7978 1.80 29.7500 29.75 64.2857 64.3%
Winnable

1 7 4 5

17 5.5298 5.53 25.6561 25.66 60.7143 60.7%
In The Game

2 6 4 5

17 3.9657 3.97 26.1207 26.12 60.7143 60.7%
Elo Predicts!

3 6 4 4

17 3.0723 3.07 27.5000 27.50 60.7143 60.7%
Hyperion

3 5 4 5

17 0.6310 0.63 27.4286 27.43 60.7143 60.7%
Massey Ratings

2 4

6 1.1606 1.16 35.5833 35.58 †16 50.0000 50.0%

AFL Ladder Predictor

Squiggle AFL Ladder Predictor

Live Squiggle

Twitter

Tweets by SquiggleAFL

Friends of Squiggle

  • Live Ladders
  • Matter of Stats
  • HPN
  • FMI
  • Wheelo Ratings
  • AFLalytics
  • AFL Lab
  • PlusSixOne
  • Graft
  • Massey Ratings
  • ZaphBot
  • Glicko Ratings
  • Cheap Stats
  • Figuring Footy
  • The Footycast
  • AFL Scorigami
  • Data by Josh
  • Elo Predicts!
  • Stattraction
  • The Wooden Finger
  • Drop Kick Data
  • Hyperion
  • footycharts
  • Winnable
  • What Snoo Thinks
  • Informed Stats
  • HBin
  • Holy Grail Ratings
  • In The Game
  • The Flag
  • The Arc
  • Figuring Footy
  • BigFooty

About Squiggle

Squiggle gathers online AFL prediction & analysis and makes it look pretty. By Max Barry.

SQUIGGLE API

Need free data? Try the Squiggle API.