Skip to content
Squiggle
@squiggle.au @SquiggleAFL Discord

Who won the pre-season?

Posted on March 14, 2017March 17, 2017 by Max Barry

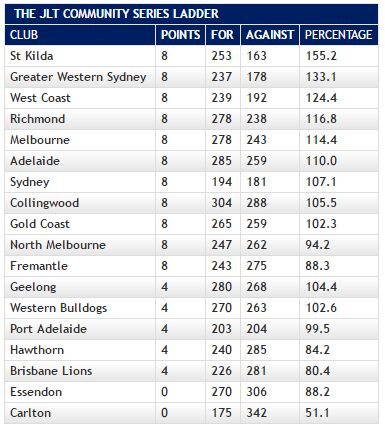
FootyMaths institute takes a stab at rating pre-season performance by adjusting for quality of opposition:

And as it happens, by the FMI method, St Kilda did indeed have a good pre-season series. And as another wake-up call to the competition, Essendon were next best, with Richmond and Brisbane all but a tie for third.

Read more at: FOOTYMATHS INSTITUTE: POST-JLT: BREAK

CategoriesFootyMaths Institute, Pre-season

Post navigation

Previous PostPrevious Who will make the finals? The wisdom of crowds
Next PostNext Welcome PlusSixOne!

Wins % Range
1
Sydney 17.3 141%
1
2
3
4
5
6
7
8
9
10
11
12
13
14
15
16
17
18
1
2
Hawthorn 16.1 127%
1
2
3
4
5
6
7
8
9
10
11
12
13
14
15
16
17
18
2–3
3
Fremantle 16.4 122%
1
2
3
4
5
6
7
8
9
10
11
12
13
14
15
16
17
18
2–4
4
Geelong 15.4 125%
1
2
3
4
5
6
7
8
9
10
11
12
13
14
15
16
17
18
3–5
5
Brisbane Lions 14.1 119%
1
2
3
4
5
6
7
8
9
10
11
12
13
14
15
16
17
18
4–5
6
Gold Coast 13.3 109%
1
2
3
4
5
6
7
8
9
10
11
12
13
14
15
16
17
18
6–7
7
Western Bulldogs 12.8 102%
1
2
3
4
5
6
7
8
9
10
11
12
13
14
15
16
17
18
7–8
8
Adelaide 12.6 105%
1
2
3
4
5
6
7
8
9
10
11
12
13
14
15
16
17
18
6–9
9
Collingwood 12.0 104%
1
2
3
4
5
6
7
8
9
10
11
12
13
14
15
16
17
18
8–10
10
Melbourne 11.9 96%
1
2
3
4
5
6
7
8
9
10
11
12
13
14
15
16
17
18
9–11
11
St Kilda 11.1 105%
1
2
3
4
5
6
7
8
9
10
11
12
13
14
15
16
17
18
10–13
12
GWS 10.9 95%
1
2
3
4
5
6
7
8
9
10
11
12
13
14
15
16
17
18
10–12
13
North Melbourne 10.0 96%
1
2
3
4
5
6
7
8
9
10
11
12
13
14
15
16
17
18
13–14
14
Port Adelaide 9.6 101%
1
2
3
4
5
6
7
8
9
10
11
12
13
14
15
16
17
18
12–14
15
Carlton 7.3 88%
1
2
3
4
5
6
7
8
9
10
11
12
13
14
15
16
17
18
15
16
Essendon 5.8 76%
1
2
3
4
5
6
7
8
9
10
11
12
13
14
15
16
17
18
16–17
17
West Coast 5.8 66%
1
2
3
4
5
6
7
8
9
10
11
12
13
14
15
16
17
18
16–17
18
Richmond 4.3 63%
1
2
3
4
5
6
7
8
9
10
11
12
13
14
15
16
17
18
18

After 1 game of Round 10, 2026.

PROJECTIONS
W L D % History Wins Finish
1
Sydney 8∗ 1 – 157.2%
+9.3
1
2
Fremantle 8∗ 1 – 131.6%
+8.4
3
3
Geelong 7 3 – 123.5%
+8.4
4
4
Hawthorn 6∗ 2 1 116.8%
+9.6
2
5
Gold Coast 6∗ 3 – 118.5%
+7.3
6
6
Brisbane Lions 6 4 – 116.6%
+8.1
5
7
Melbourne 6∗ 3 – 103.9%
+5.9
10
8
Adelaide 5∗ 4 – 101.7%
+7.6
8
9
Western Bulldogs 5∗ 4 – 92.4%
+7.8
7
10
Collingwood 4∗ 4 1 99.9%
+7.5
9
11
St Kilda 4∗ 5 – 109.3%
+7.1
11
12
North Melbourne 4∗ 5 – 104.4%
+6.0
13
13
GWS 4∗ 5 – 91.1%
+6.9
12
14
Port Adelaide 3∗ 6 – 109.5%
+6.6
14
15
West Coast 2∗ 7 – 60.1%
+3.8
17
16
Carlton 1∗ 8 – 79.3%
+6.3
15
17
Essendon 1∗ 8 – 71.8%
+4.8
16
18
Richmond 1∗ 8 – 60.3%
+3.3
18

∗ Yet to play

Power Rankings

Models Leaderboard

Tips Bits MAE Correct
Wheelo Ratings

3 7 6 6 6 8 8 8 8 8 0

68 23.6170 23.62 24.2607 24.26 82.9268 82.9%
Drop Kick Data

3 7 5 6 6 8 8 8 8 8 0

67 24.3054 24.31 25.4671 25.47 81.7073 81.7%
s10

2 8 5 5 5 8 8 7 8 9 0

65 24.2410 24.24 25.5937 25.59 79.2683 79.3%
Glicko Ratings

3 7 5 5 6 8 8 7 8 8 0

65 22.1837 22.18 25.8244 25.82 79.2683 79.3%
Holy Grail Ratings

4 8 5 6 4 8 8 8 7 7 0

65 15.6825 15.68 25.5685 25.57 79.2683 79.3%
Punters

2 6 4 6 6 8 8 8 8 8 0

64 24.2599 24.26 25.1849 25.18 78.0488 78.0%
ZaphBot

2 7 5 6 5 8 7 8 7 9 0

64 23.9861 23.99 26.7073 26.71 78.0488 78.0%
Aggregate

2 7 5 6 5 8 8 7 7 9 0

64 22.2850 22.29 25.7815 25.78 78.0488 78.0%
Cheap Stats

3 5 3 7 6 7 8 8 8 9 0

64 17.3444 17.34 26.6707 26.67 78.0488 78.0%
Matter of Stats

3 7 5 6 5 7 7 8 8 7 0

63 25.0330 25.03 26.2457 26.25 76.8293 76.8%
Don't Blame the Data

2 7 5 6 5 8 8 7 7 8 0

63 25.0249 25.02 26.3376 26.34 76.8293 76.8%
AFLalytics

4 7 5 5 5 7 8 7 7 8 0

63 22.9507 22.95 25.9830 25.98 76.8293 76.8%
The Wooden Finger

2 8 5 6 5 6 7 7 7 9 0

62 22.2330 22.23 27.5854 27.59 75.6098 75.6%
footycharts

3 7 5 6 5 6 8 7 7 8 0

62 21.5615 21.56 26.3284 26.33 75.6098 75.6%
What Snoo Thinks

3 8 5 6 4 6 8 8 7 7 0

62 21.4538 21.45 25.8749 25.87 75.6098 75.6%
AFL Lab

2 7 4 6 6 7 8 7 6 9 0

62 20.7000 20.70 26.6940 26.69 75.6098 75.6%
The Cruncher

2 7 5 5 5 6 8 7 8 8 0

61 22.1498 22.15 27.2139 27.21 74.3902 74.4%
AFL Scorigami

3 7 5 5 6 6 7 8 8 6 0

61 20.5497 20.55 26.2700 26.27 74.3902 74.4%
HBin

4 7 5 5 4 6 8 7 7 8 0

61 20.1228 20.12 26.4939 26.49 74.3902 74.4%
In The Game

2 6 4 5 5 7 8 8 7 7 0

59 22.4628 22.46 27.0282 27.03 71.9512 72.0%
Stattraction

2 6 5 6 4 5 8 7 7 9 0

59 21.5515 21.55 26.5712 26.57 71.9512 72.0%
Winnable

1 7 4 5 5 7 7 8 7 8 0

59 21.1909 21.19 25.9201 25.92 71.9512 72.0%
Live Ladders

2 7 5 5 5 7 8 7 6 7 0

59 20.4062 20.41 26.6829 26.68 71.9512 72.0%
Informed Stats

2 7 4 5 5 6 8 7 8 7 0

59 20.1178 20.12 27.5854 27.59 71.9512 72.0%
Graft

3 7 4 6 4 5 7 7 7 9 0

59 19.8223 19.82 28.8537 28.85 71.9512 72.0%
PlusSixOne

2 7 4 5 5 5 8 7 7 8 0

58 17.5855 17.59 26.9488 26.95 70.7317 70.7%
Squiggle

1 7 5 5 5 6 7 8 6 7 0

57 18.3584 18.36 26.5507 26.55 69.5122 69.5%
The Footycast

2 7 4 5 5 5 8 7 7 7 0

57 17.1376 17.14 26.7854 26.79 69.5122 69.5%
Elo Predicts!

3 6 4 4 4 4 7 7 7 9 0

55 17.5972 17.60 26.9756 26.98 67.0732 67.1%
Hyperion

3 5 4 5 5 8 7 7 9 0

53 16.0689 16.07 27.6438 27.64 †9 72.6027 72.6%
Massey Ratings

2 4 5 8 8 7 9 0

43 17.6849 17.68 28.2018 28.20 †25 75.4386 75.4%

AFL Ladder Predictor

Squiggle AFL Ladder Predictor

Live Squiggle

Twitter

Tweets by SquiggleAFL

Friends of Squiggle

  • Live Ladders
  • Matter of Stats
  • HPN
  • FMI
  • Wheelo Ratings
  • AFLalytics
  • AFL Lab
  • PlusSixOne
  • Graft
  • Massey Ratings
  • ZaphBot
  • Glicko Ratings
  • Cheap Stats
  • Figuring Footy
  • The Footycast
  • AFL Scorigami
  • Data by Josh
  • Elo Predicts!
  • Stattraction
  • The Wooden Finger
  • Drop Kick Data
  • Hyperion
  • footycharts
  • Winnable
  • What Snoo Thinks
  • Informed Stats
  • HBin
  • Holy Grail Ratings
  • In The Game
  • The Flag
  • The Arc
  • Figuring Footy
  • BigFooty

About Squiggle

Squiggle gathers online AFL prediction & analysis and makes it look pretty. By Max Barry.

SQUIGGLE API

Need free data? Try the Squiggle API.