Models Leaderboard After Home & Away

2017 has been a rough year for tipping, even tougher than 2016, which itself was a wake-up call after the lovely, predictable Hawthorn dynasty.

Sadly, none of the models managed to outperform the bookies in tipping winners head-to-head during the Home & Away season, nor in terms of probabilistic Bits.

Tips Bits MAE Correct
Punters

4 8 4 7 7 6 3 5 5 7 4 4 3 7 5 5 7 6 6 9 8 7 5

132 22.1970 66.7%
PlusSixOne

5 8 4 7 6 6 3 5 6 7 3 3 2 8 5 7 7 5 6 5 8 7 6

129 17.9055 28.89 65.2%

5 9 4 6 7 6 3 5 4 7 4 3 2 6 5 5 6 7 7 8 6 6 7

128 17.5804 64.6%

3 8 5 6 7 7 4 5 4 7 4 1 3 6 4 6 8 7 7 8 6 6 6

128 16.3202 28.87 64.6%

5 7 5 6 6 6 4 5 7 7 3 2 3 7 3 5 7 5 7 7 7 7 7

128 15.4157 30.11 64.6%
Aggregate

5 8 4 6 7 6 3 5 5 7 3 3 2 6 4 5 7 6 7 8 7 6 5

125 20.1305 28.92 63.1%

5 7 5 6 6 6 3 5 5 7 3 3 3 6 4 6 7 6 6 7 7 6 6

125 16.5200 29.03 63.1%

4 7 4 6 7 6 3 5 5 7 4 3 2 6 3 5 6 6 7 8 8 6 5

123 18.6520 28.73 62.1%

5 8 5 5 5 6 3 5 5 8 4 2 2 7 3 6 7 6 6 7 6 5 6

122 17.0455 29.79 61.6%

A particularly rough year for Squiggle’s in-house tipping algorithm, which came in dead last and didn’t deserve to be any higher. But very credible performances elsewhere, especially from Plus Six One (for the second year in a row), and it’s worth noting The Arc‘s chart-topping Mean Average Error in a year when the line-ball games didn’t fall their way.

I was curious this year to see what kind of performance the Aggregate would have, where it represents a simple average of everyone else’s tips. Would there be some kind of wisdom of the crowds effect, where it could outperform most of the individual models that provided its inputs? Well, kind of: It landed mid-table in terms of tips and MAE, but with more Bits than all models. So there could be something there.

Apologies for finals tipping being a little shaky at the moment: Apparently everyone (including Squiggle) uses different formatting for posting their finals tips, and squiggle-bot needs to learn how to parse it.

The Quality and Quantity of Shots Created by Each Club

A super interesting and insightful article on shot generation and shot quality from Figuring Footy:

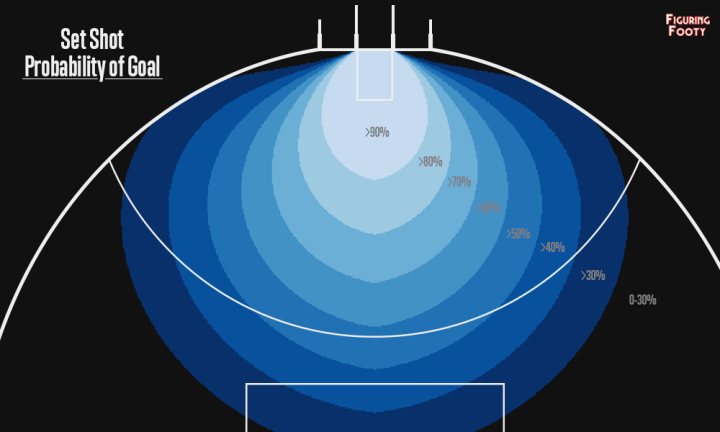
GWS have been the polar opposite of the Dees in regard to shot quality. The Giants have taken, on average, the toughest shots of any team this year. This is usually a high variance strategy, but the Giants have managed to get through some close games (relatively) unscathed, benefiting greatly from the sublime kicking skills of their young talent.

Source: The Quality and Quantity of Shots Created by Each Club – Figuring Footy

Tip Leaderboard after Round 17

The Tip Leaderboard has developed a bit of spread over the last few weeks! PlusSixOne has pulled away to a whopping four tips lead over the next best model, and it’s leading in Bits as well:

Tips Bits
PlusSixOne

5 8 4 7 6 6 3 5 6 7 3 3 2 8 5 7 7

92 9.5796
Punters

4 8 4 7 7 6 3 5 5 7 4 4 3 7 5 5 7

91 8.0603

5 7 5 6 6 6 4 5 7 7 3 2 3 7 3 5 7

88 3.6086

3 8 5 6 7 7 4 5 4 7 4 1 3 6 4 6 8

88 2.7082

5 7 5 6 6 6 3 5 5 7 3 3 3 6 4 6 7

87 4.6444

5 9 4 6 7 6 3 5 4 7 4 3 2 6 5 5 6

87 4.0108
Aggregate

5 8 4 6 7 6 3 5 5 7 3 3 2 6 4 5 7

86 7.3906

5 8 5 5 5 6 3 5 5 8 4 2 2 7 3 6 7

86 4.1921

4 7 4 6 7 6 3 5 5 7 4 3 2 6 3 5 6

83 6.1518

“Bits” from Monash University Probabilistic Footy Tipping rewards tipsters for saying a win was likely and punishes them for saying it was unlikely.

New to Squiggle is Graft Ratings! Head on over for beautiful tips and projections of all kinds. Graft is having what appears to be a typical model year so far, sitting solidly in the 86-88 tip bracket.

And The Arc can be justifiably feeling a little screwed, with the worst tip numbers despite very respectable Bits and MAE (stats available on the main leaderboard page).

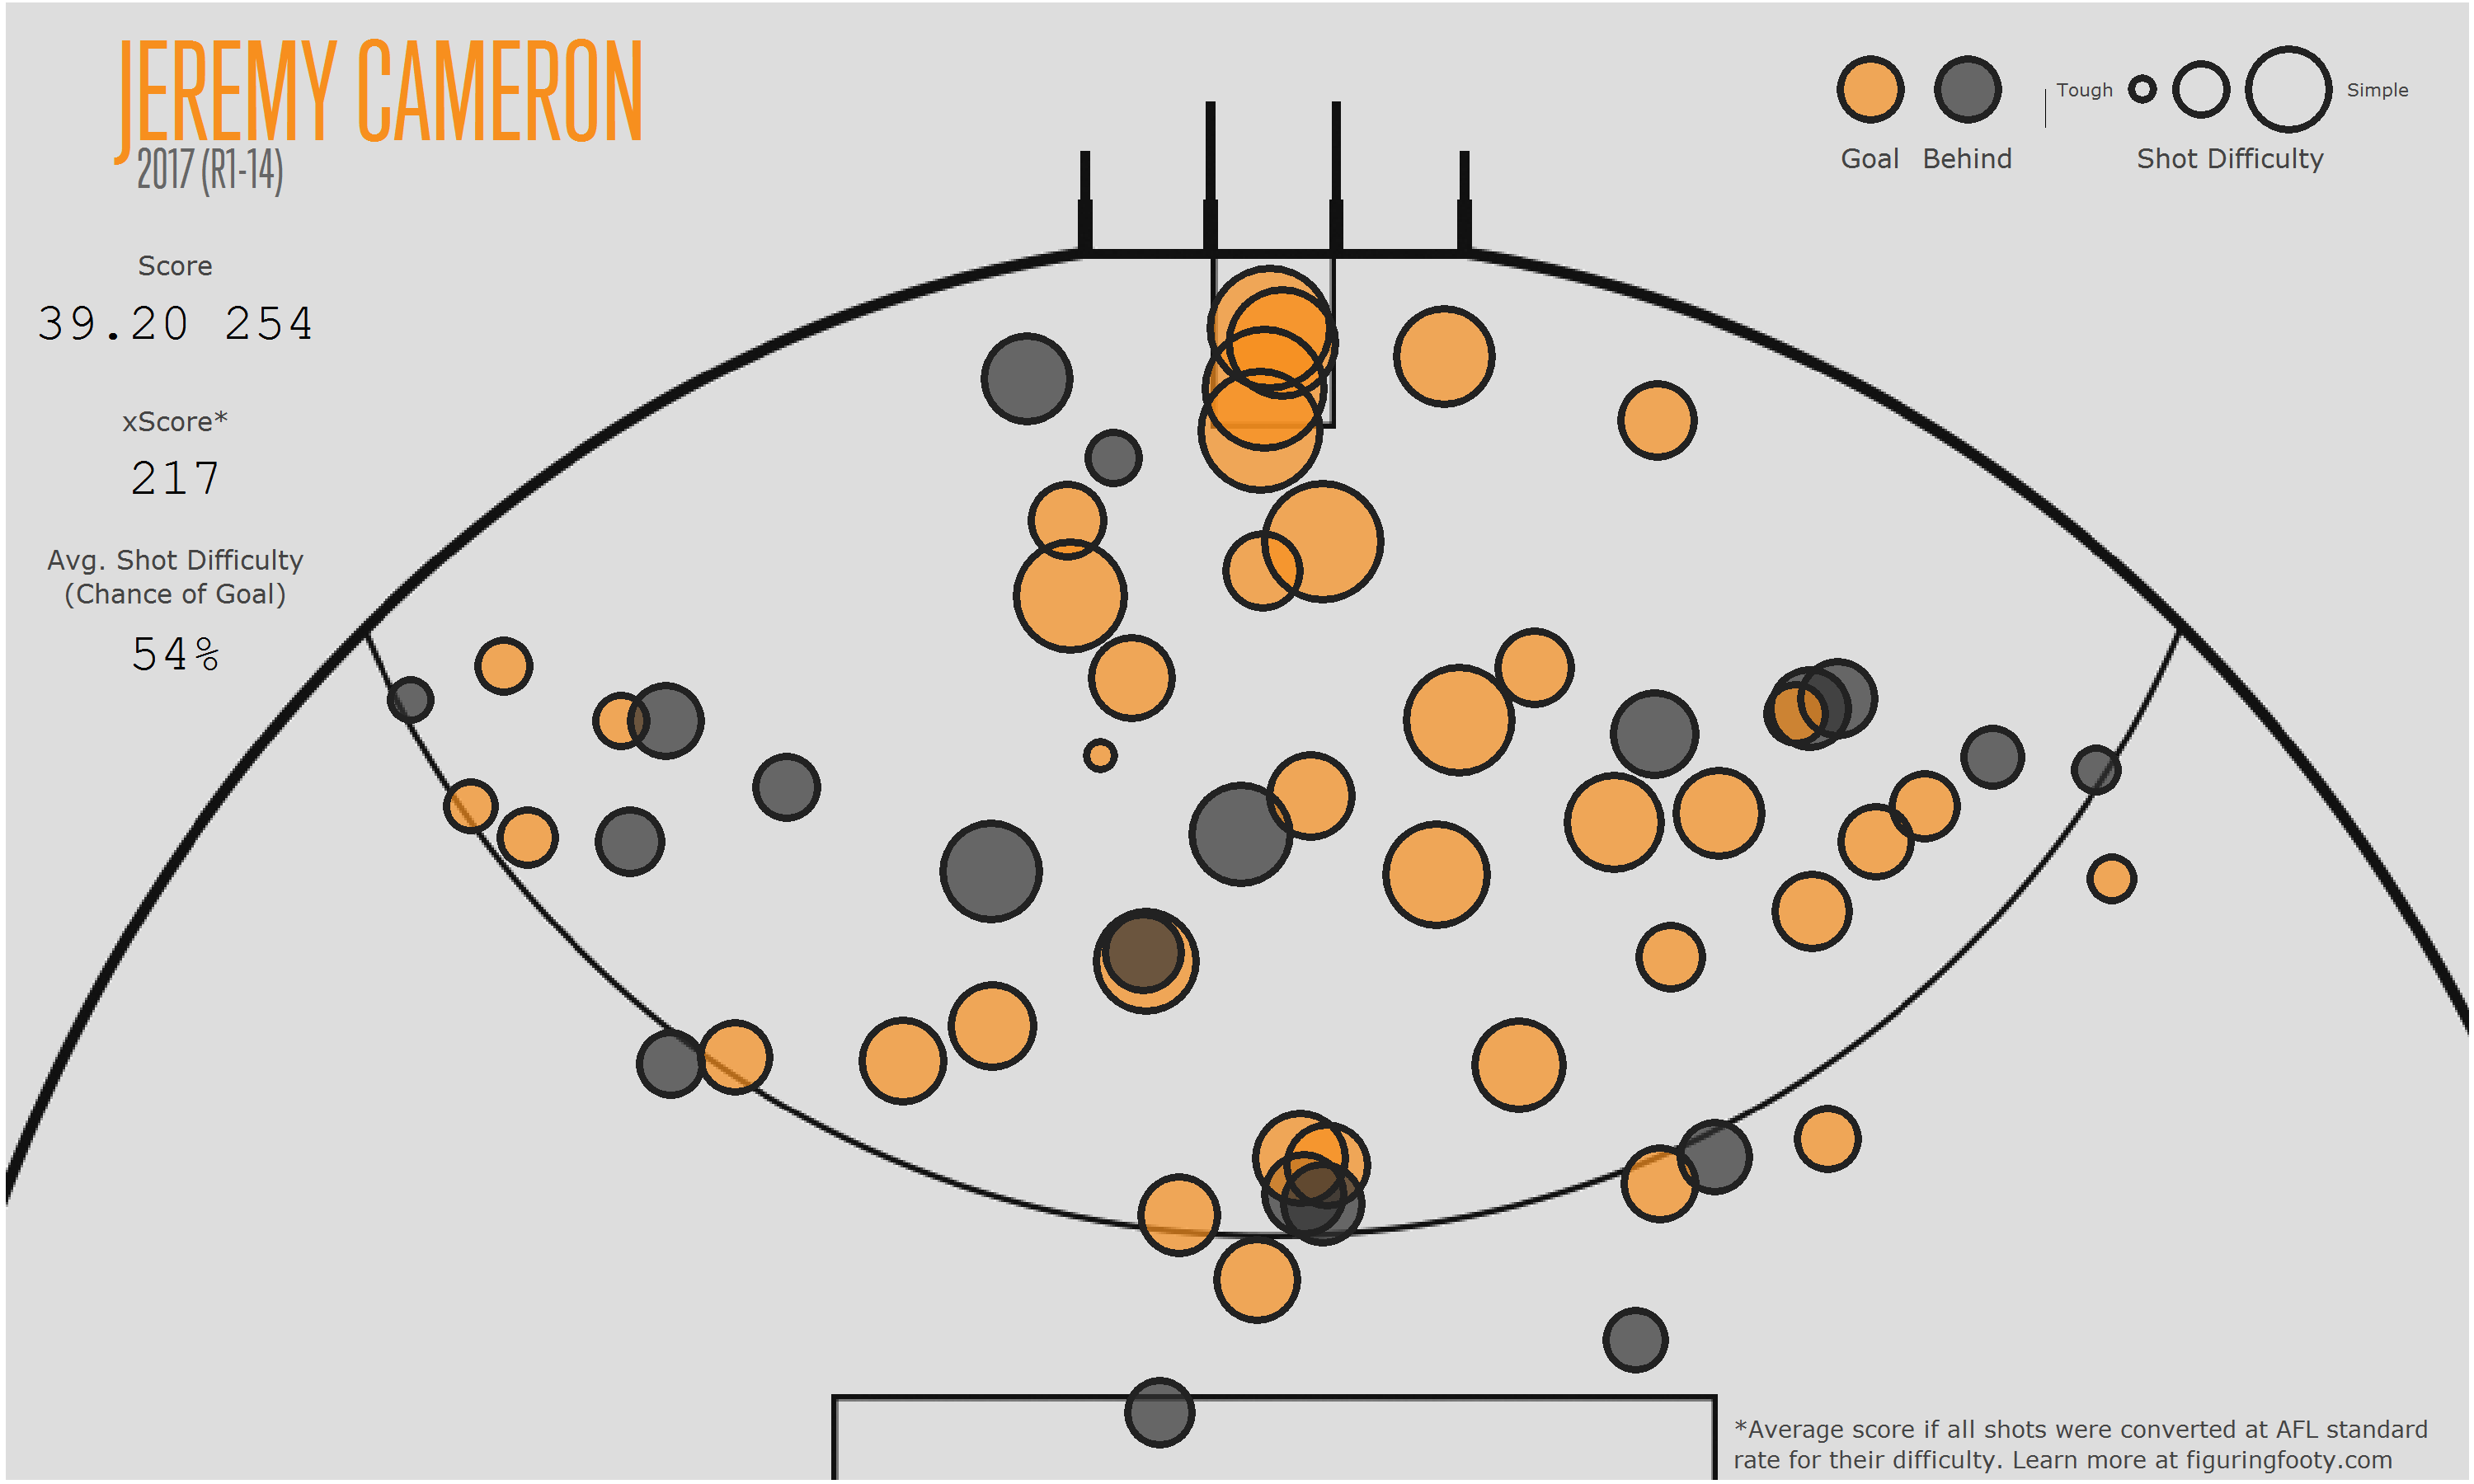
Every Shot in the 2017 Coleman Medal Race

Figuring Footy compares the Coleman Medal contenders:

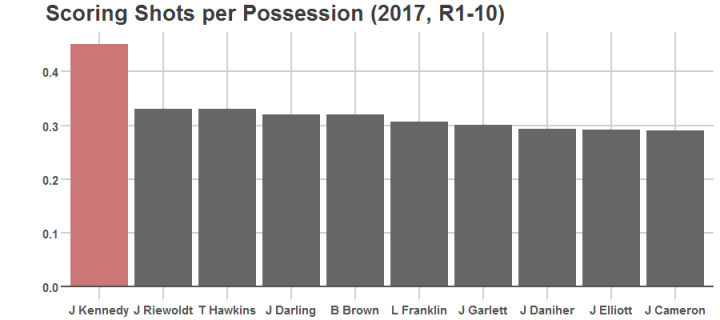
The injury to Josh Kennedy is dragging on. With Adam Simpson ruling out the two-time Coleman medalist from the Eagles’ elimination final rematch with the Dogs on Saturday, the calf injury that was originally expected to see Kennedy miss just the one game is now stretching into its sixth week. This is bad news for the Eagles, but it does have the positive side effect of throwing the race for the Coleman medal wide open.

Source: Every Shot in the 2017 Coleman Medal Race – Figuring Footy

Are West Coast too Dependent on Kennedy?

Figuring Footy on West Coast’s unique reliance on Josh Kennedy:

A narrow focused, key-forward structure has typified the Eagles’ year so far. Unlike other teams who rely on either midfielders pushing up or a multi-faceted forwardline to kick a winning score, the 2017 Eagles have relied on a few key forwards kicking bags, and when they haven’t been able to, the whole team has struggled.

Source: Are West Coast too Dependent on Kennedy? – Figuring Footy

The 6 Best Long Range Goals of the Last 6 Years

The AFL’s arrangement with Champion Data means that only basic stats are released to the public, which is a real barrier to those of us who’d like to do interesting things with it. For example, with shot position data, you can compile an awesome list like this one from Figuring Footy:

Since 2012 there were 28,530 goals kicked, but only around 150 of them were kicked from further out than 60m. And a fair chunk of these were kicks to full-forward which somehow slipped through the contest and over the goal line without taking a touch.

There are probably only about 40 odd examples over the last 6 years of a player backing themselves in from outside 60m and then actually delivering. These are 6 of my favourites.

Source: The 6 Best Long Range Goals of the Last 6 Years – Figuring Footy

The Bookies Bite Back

Punters have known best lately, with the favorites returning 7 tips in each of the last two rounds.

But Figuring Footy is still claiming first place off the back of a great season opening!

Tips Bits

5 9 4 6 7

31 4.1117
Punters

4 8 4 7 7

30 5.6630
PlusSixOne

5 8 4 7 6

30 4.6239
Aggregate

5 8 4 6 7

30 4.0893

5 7 5 6 6

29 1.0637

4 7 4 6 7

28 3.8395

3 8 4 6 7

28 3.3945

5 8 5 5 5

28 1.5787

Disaster for Squiggle, which went out on a limb on Round 5 tips for North Melbourne over Fremantle, and the Demons over the Tigers, and came up short on both.

You can now track these numbers in the new auto-updating Tip Leaderboard.


The Secret Weapon of the AFL’s Best Forward-line – Figuring Footy

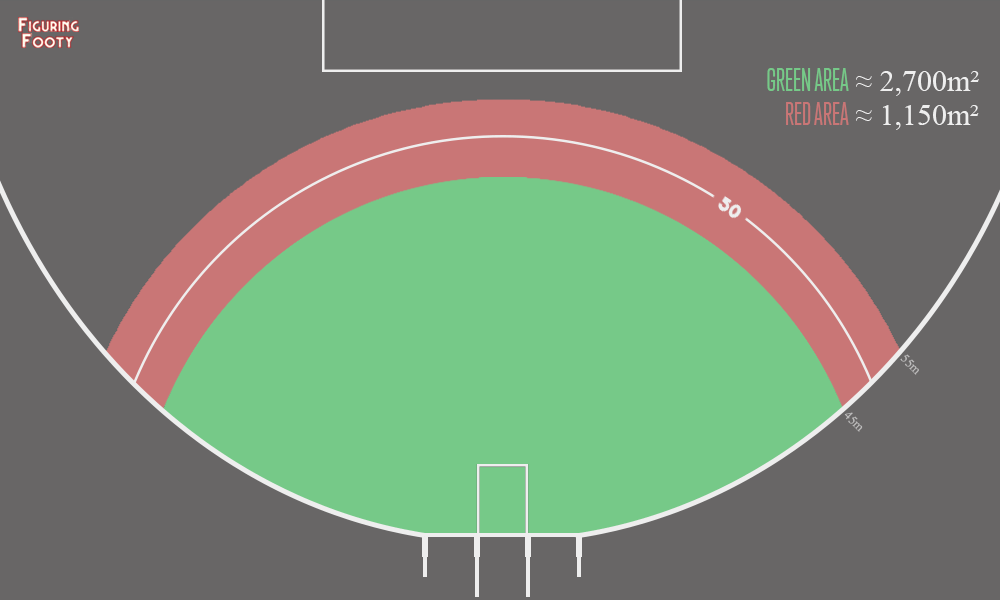
Figuring Footy shows just how much extra attacking real estate a side gains when it can kick goals from further out, and looks at how effectively Adelaide are using it:

Because the ground opens out wider the further you get from goal, adding an extra 10 metres to your kicking distance does not just increase your opportunities by 20%, but rather increases the size of your “goal scoring zone” by around 43%. This is a massive increase in the area the opposition needs to defend, both from leading forwards and midfielders/backmen drifting forward.

Source: The Secret Weapon of the AFL’s Best Forward-line – Figuring Footy

Why 2017 Results Are Flattering The Cats – Figuring Footy

Figuring Footy ShotPlots are back!

One other method used by most footy fans is considering the number of scoring shots. A team leading 3 goals straight to 1.11 is probably not dominating the game to the standard they’d like. The problem with this method is that goals/behinds doesn’t tell us anything about the difficulty of the chances each team is creating. Maybe a return of 1.11 is about right if all a team is doing is pinging it from the centre square.

Source: Why 2017 Results Are Flattering The Cats – Figuring Footy