Skip to content
Squiggle
@squiggle.au @SquiggleAFL Discord

Why can’t the Eagles fly?

Posted on April 23, 2017April 23, 2017 by Max Barry

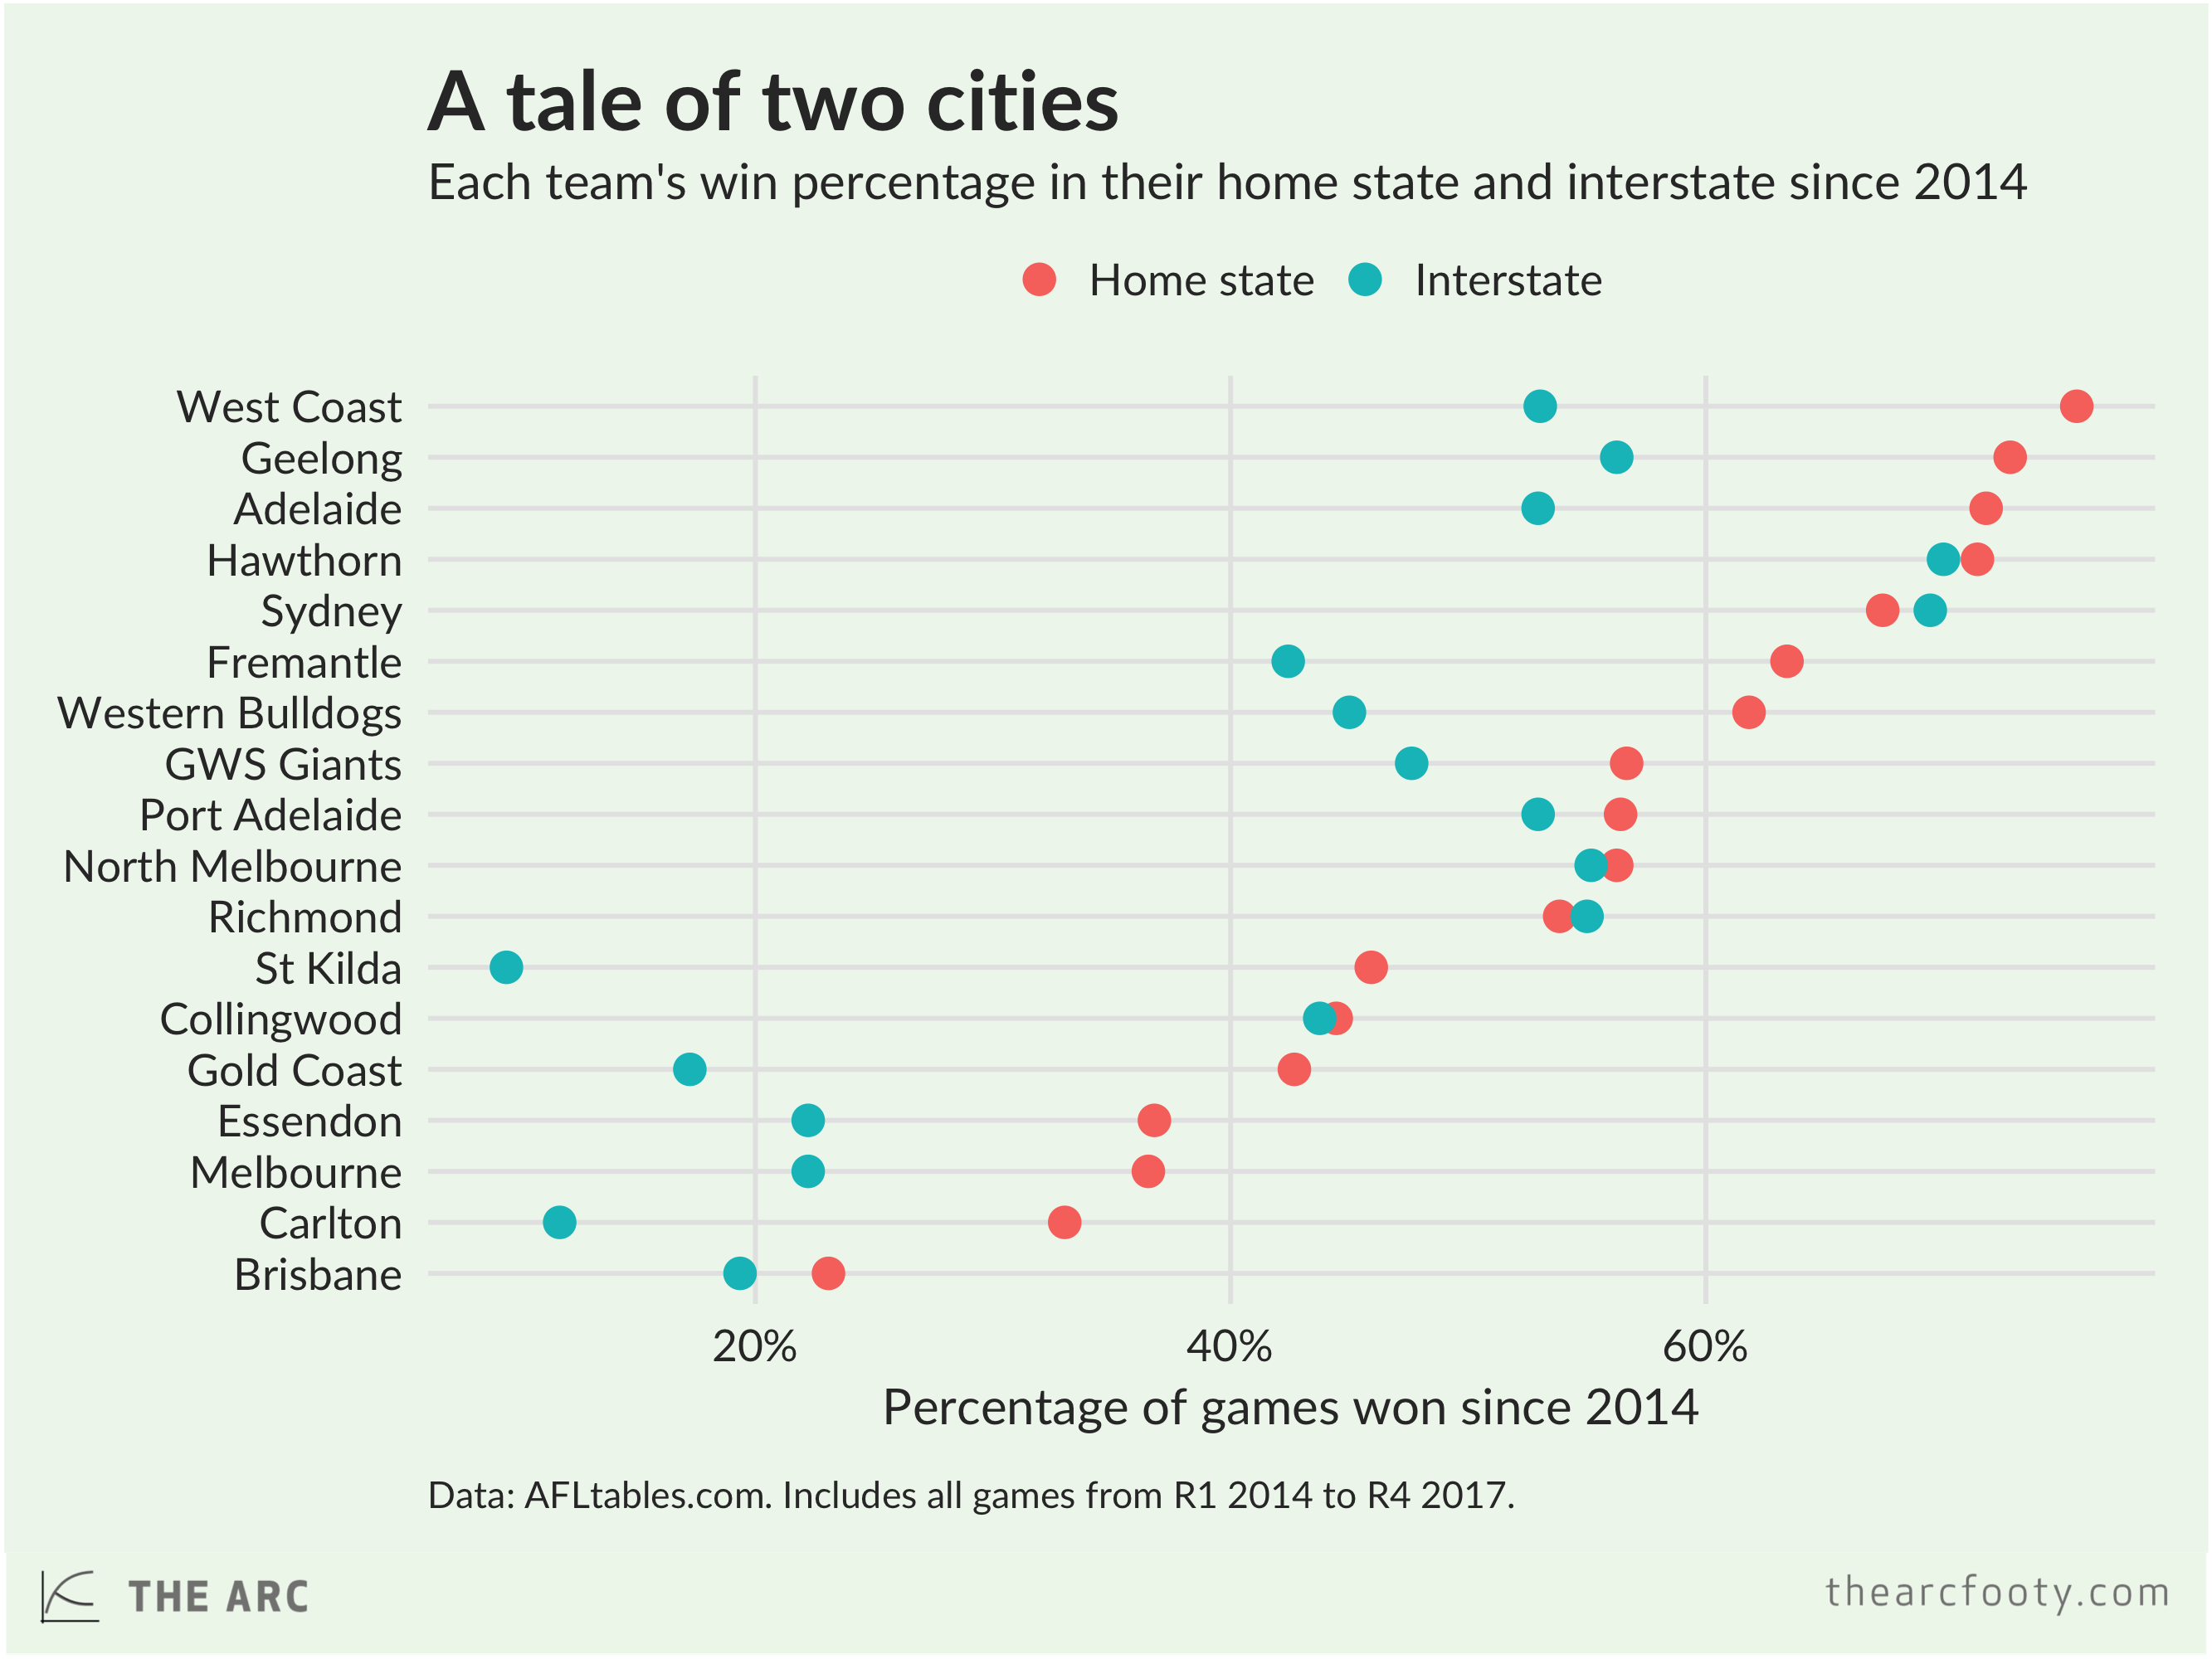
The Arc takes a look at win rates on the road:

The difference between the Eagles’ win percentage in their home state (75.6%) and interstate (53%) is 22.6% – the third largest in the league, but not a million miles away from some other quality teams.

Source: Why can’t the Eagles fly? | The Arc

CategoriesThe Arc

Post navigation

Previous PostPrevious Are North and Hawthorn bad, or have they just faced a tough draw?
Next PostNext Matter of Stats Team Dashboard for Round 5

Wins % Range
1
Collingwood 17.7 137%
1
2
3
4
5
6
7
8
9
10
11
12
13
14
15
16
17
18
1
2
Geelong 16.3 134%
1
2
3
4
5
6
7
8
9
10
11
12
13
14
15
16
17
18
2
3
Adelaide 15.3 130%
1
2
3
4
5
6
7
8
9
10
11
12
13
14
15
16
17
18
3–5
4
Brisbane Lions 15.0 109%
1
2
3
4
5
6
7
8
9
10
11
12
13
14
15
16
17
18
4–5
5
Gold Coast 14.5 119%
1
2
3
4
5
6
7
8
9
10
11
12
13
14
15
16
17
18
4–6
6
Western Bulldogs 14.1 133%
1
2
3
4
5
6
7
8
9
10
11
12
13
14
15
16
17
18
3–8
7
Hawthorn 13.4 110%
1
2
3
4
5
6
7
8
9
10
11
12
13
14
15
16
17
18
7–8
8
Fremantle 13.3 108%
1
2
3
4
5
6
7
8
9
10
11
12
13
14
15
16
17
18
6–9
9
GWS 12.8 106%
1
2
3
4
5
6
7
8
9
10
11
12
13
14
15
16
17
18
8–9
10
Carlton 10.5 104%
1
2
3
4
5
6
7
8
9
10
11
12
13
14
15
16
17
18
10
11
Essendon 10.2 82%
1
2
3
4
5
6
7
8
9
10
11
12
13
14
15
16
17
18
11–13
12
St Kilda 9.6 91%
1
2
3
4
5
6
7
8
9
10
11
12
13
14
15
16
17
18
11–14
13
Melbourne 9.7 90%
1
2
3
4
5
6
7
8
9
10
11
12
13
14
15
16
17
18
12–14
14
Sydney 9.6 92%
1
2
3
4
5
6
7
8
9
10
11
12
13
14
15
16
17
18
11–14
15
Port Adelaide 9.0 83%
1
2
3
4
5
6
7
8
9
10
11
12
13
14
15
16
17
18
15
16
North Melbourne 5.9 76%
1
2
3
4
5
6
7
8
9
10
11
12
13
14
15
16
17
18
16–17
17
Richmond 6.0 71%
1
2
3
4
5
6
7
8
9
10
11
12
13
14
15
16
17
18
16–17
18
West Coast 3.9 67%
1
2
3
4
5
6
7
8
9
10
11
12
13
14
15
16
17
18
18

After 2 games of Round 13, 2025.

PROJECTIONS
W L D % History Wins Finish
1
Collingwood 10∗ 2 – 136.9%
+7.7
1
2
Brisbane Lions 9 3 1 112.6%
+5.5
4
3
Adelaide 9 4 – 137.2%
+6.3
3
4
Gold Coast 8∗ 3 – 127.8%
+6.5
5
5
Geelong 8∗ 4 – 124.8%
+8.3
2
6
Hawthorn 8 5 – 111.8%
+5.4
7
7
GWS 7∗ 5 – 109.4%
+5.8
9
8
Fremantle 7∗ 5 – 106.4%
+6.3
8
9
Western Bulldogs 6∗ 6 – 122.1%
+8.1
6
10
Essendon 6∗ 5 – 84.6%
+4.2
11
11
St Kilda 5∗ 7 – 93.1%
+4.6
12
12
Melbourne 5∗ 7 – 87.6%
+4.7
13
13
Carlton 4∗ 7 – 102.8%
+6.5
10
14
Sydney 4∗ 8 – 85.7%
+5.6
14
15
Port Adelaide 4∗ 7 – 79.1%
+5.0
15
16
Richmond 3∗ 9 – 71.1%
+3.0
17
17
North Melbourne 2∗ 8 1 78.1%
+3.4
16
18
West Coast 1∗ 11 – 64.5%
+2.9
18

∗ Yet to play

Power Rankings

Models Leaderboard

Tips Bits MAE Correct
Matter of Stats

2 8 4 8 7 7 5 9 6 6 6 6 5 1

80 16.70 27.68 74.8%
Glicko Ratings

2 8 5 7 7 7 5 7 6 8 6 6 4 1

79 16.46 27.44 73.8%
Live Ladders

2 7 3 8 7 8 5 7 6 8 5 6 5 1

78 17.91 27.79 72.9%
Winnable

1 8 6 6 7 7 4 9 7 6 6 6 4 1

78 17.54 27.40 72.9%
Aggregate

2 8 5 7 7 7 5 7 6 6 6 6 5 1

78 16.51 27.49 72.9%
AFL Lab

2 8 4 6 7 7 7 7 8 6 5 5 5 1

78 16.11 28.03 72.9%
Don't Blame the Data

2 8 3 7 7 8 5 7 7 6 6 6 4 1

77 17.77 27.39 72.0%
s10

2 8 5 7 7 6 5 7 7 6 5 6 5 1

77 16.65 27.43 72.0%
Informed Stats

1 8 6 7 6 7 4 9 7 5 6 5 5 1

77 15.72 28.80 72.0%
Punters

1 8 5 7 7 6 4 7 6 7 6 7 5 1

77 14.96 27.84 72.0%
Drop Kick Data

2 8 5 6 7 7 5 7 6 6 5 6 5 1

76 18.87 27.04 71.0%
AFLalytics

2 7 5 7 7 6 4 8 7 6 6 6 4 1

76 16.14 27.53 71.0%
The Wooden Finger

2 8 4 7 5 7 4 7 8 6 5 6 6 1

76 15.20 29.10 71.0%
Wheelo Ratings

1 8 5 6 7 6 4 6 7 7 6 6 5 1

75 17.61 27.10 70.1%
Squiggle

1 7 5 8 7 5 6 6 6 6 6 6 5 1

75 14.89 28.33 70.1%
Cheap Stats

1 8 5 7 7 7 5 6 6 6 6 5 5 1

75 13.64 27.52 70.1%
What Snoo Thinks

1 8 3 7 6 8 4 7 8 7 5 5 4 1

74 16.09 27.85 69.2%
The Cruncher

2 7 5 6 7 6 4 7 6 6 6 6 4 1

73 16.05 27.26 68.2%
footycharts

2 7 3 8 7 6 5 8 6 6 4 6 4 1

73 15.14 28.46 68.2%
Stattraction

2 7 4 8 6 6 4 8 7 6 5 5 4 1

73 14.09 28.34 68.2%
ZaphBot

1 8 6 7 7 6 3 7 7 5 5 7 3 0

72 13.54 28.83 67.3%
The Footycast

1 7 5 6 6 6 4 6 8 6 5 6 5 1

72 9.48 29.94 67.3%
Massey Ratings

1 8 5 6 6 6 4 6 6 5 5 6 5 1

70 15.50 28.07 65.4%
Graft

1 5 5 6 7 6 5 7 6 6 5 5 5 1

70 12.77 29.36 65.4%
Elo Predicts!

1 7 3 6 7 6 4 8 7 6 4 5 4 0

68 13.01 28.33 63.6%
AFL Scorigami

2 8 4 6 5 6 5 6 5 6 5 5 4 1

68 12.16 28.82 63.6%
Hyperion

1 7 5 6 6 7 3 6 7 5 3 7 4 0

67 11.54 29.53 62.6%
PlusSixOne

1 6 2 6 7 6 6 6 8 5 3 6 4 1

67 8.00 29.79 62.6%

AFL Ladder Predictor

Squiggle AFL Ladder Predictor

Live Squiggle

Twitter

Tweets by SquiggleAFL

Friends of Squiggle

  • Live Ladders
  • Matter of Stats
  • HPN
  • FMI
  • Wheelo Ratings
  • AFLalytics
  • AFL Lab
  • PlusSixOne
  • Graft
  • Massey Ratings
  • ZaphBot
  • Glicko Ratings
  • Cheap Stats
  • Figuring Footy
  • The Footycast
  • AFL Scorigami
  • Data by Josh
  • Elo Predicts!
  • Stattraction
  • The Wooden Finger
  • Drop Kick Data
  • Hyperion
  • footycharts
  • Winnable
  • What Snoo Thinks
  • Informed Stats
  • The Flag
  • The Arc
  • Figuring Footy
  • BigFooty

About Squiggle

Squiggle gathers online AFL prediction & analysis and makes it look pretty. By Max Barry.

SQUIGGLE API

Need free data? Try the Squiggle API.