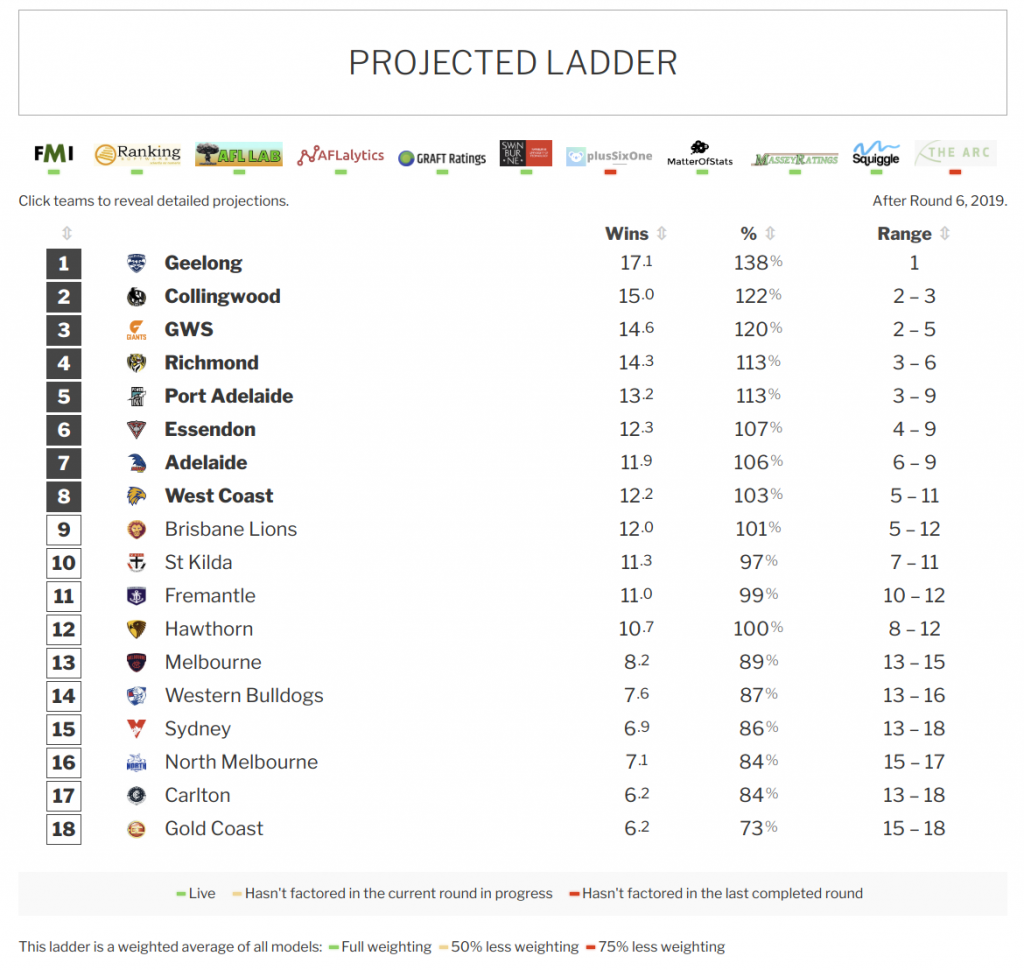
In the same way that Squiggle Dials aggregate predictions from the internet’s best AFL computer models, so does the new auto-updating aggregate Projected Ladder!
As I write (post-Round 6), it looks like this:
There are some funny quirks to projected ladders, which are quite a bit weirder than they first appear. You can read some discussion of that at the bottom of that page, but the fundamental question is: What are we trying to predict? It’s not at all clear how we should rate the accuracy of a ladder prediction — for example, is it more valuable to correctly tip who finishes 1st than who finishes 12th? How much better? How do you score a ladder that gets the ranks right but had the number of wins all wrong, compared to one that was very close on wins but had some incorrect ranks?
It’s worth noting also that a ladder prediction is not the best way to answer questions like, “What are the chances that my team makes finals?” You can find those kinds of estimates from many Squiggle-friendly models, including FMI‘s Swarms, Graft‘s Projection Boxes and PlusSixOne‘s Finishing Positions. They aren’t aggregated here, but are better targeted to those kinds of questions.
In the background, the Projected Ladder is recording the ladder predictions of each contributing model, so in the future it should be possible to go back and see how they evolved. We could even score them on how accurate they were — once we establish what it is, exactly, that we want to score.
Speaking for myself, I’m pretty sure that my Live Squiggle ladder predictions are quite a lot less intelligent than my game tips, simply because there isn’t a clear way to rate it, which makes it more difficult to refine and improve. A standard metric of some kind would help.
If you’d like to play around with this data, it’s available in a machine-readable format via the Squiggle API!

